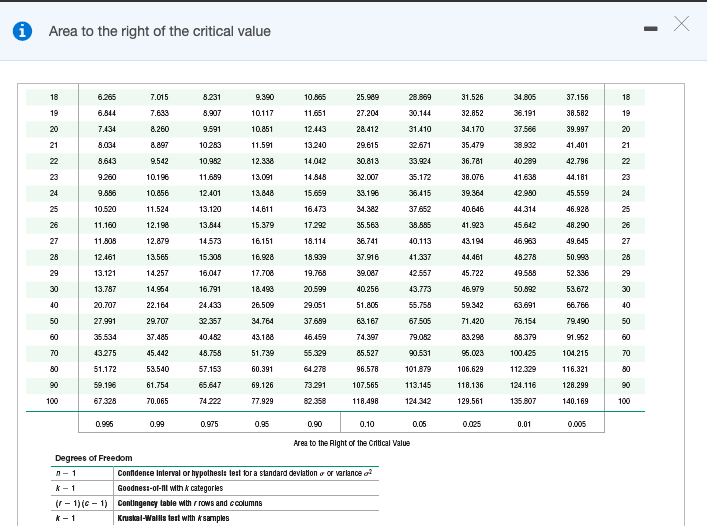
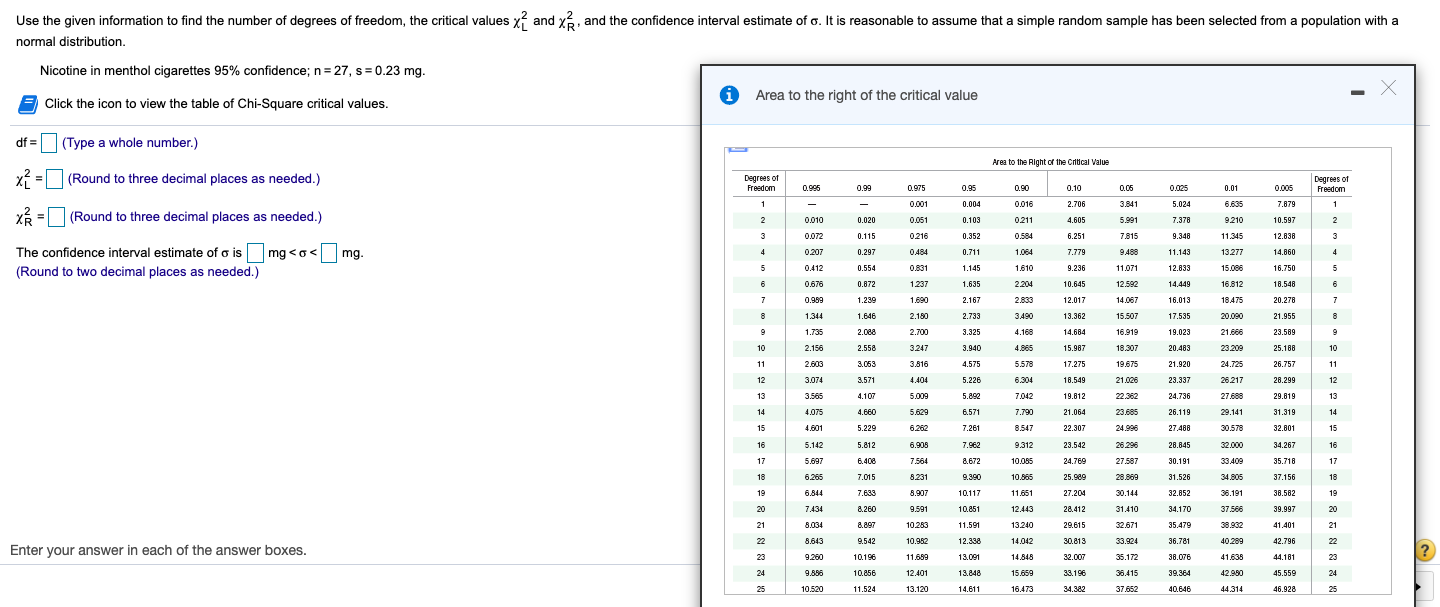
Area to the right of the critical value X 18 6.265 7.015 8.231 9.390 10.585 25.989 28.869 31.526 34.805 37.156 18 19 6.844 7.633 8.907 10.117 11.651 27.204 30.144 32.852 38.191 38.582 19 20 20 7.434 3.260 9.591 10.851 12.443 28.412 31.410 34.170 37.568 39.997 38.932 41.401 21 21 5.034 10.253 11.591 13.240 29.615 32.671 35.479 22 22 8.643 9.542 10.952 12.338 14.042 30.813 33.924 36.781 40.289 42.796 23 9.280 10.196 11.859 13.081 14.845 32.007 35.172 38.076 41.635 44.181 23 24 9.853 10.856 12.401 13.848 15.659 23.196 38.415 39.364 42.850 45.558 24 25 10.520 11.524 13.120 14.611 16.473 34.382 37.652 40.646 44.314 46.928 25 45.342 48.280 26 11.160 12.198 13.844 15.379 17.292 35.563 38.885 41.923 48.983 49.645 27 27 11.805 12.879 14.573 16.151 18.114 36.741 40.113 43.184 44.461 48.275 50.893 25 25 12.461 13.565 15.305 16.928 18.939 37.816 41.337 29 29 13.121 14.257 16.047 17.708 19.765 38.087 42.557 45.722 49.585 52.336 53.672 30 30 13.787 14.954 16.791 18.423 40.256 43.773 46.278 50.592 40 40 20.707 22.164 24.433 26.509 29.051 51.805 55.755 59.342 63.691 66.766 50 50 27.991 29.707 32.357 34.764 37.659 63.167 67.505 71.420 78.154 79.490 18.459 85.379 21.852 80 60 35.534 37.485 40.452 43.128 74.397 79.052 23.298 70 70 43.275 45.442 48.755 51.739 55.329 85.527 90.531 25.023 100.425 104.215 80 51.172 53.540 57.153 60.391 64.278 96.578 101.879 106.629 112.329 116.321 59.186 61.754 65.647 69.126 73.291 107.565 113.145 118.136 124.116 128.299 100 100 67.325 70.065 74.222 77.929 82.358 118.496 124.342 129.561 135.807 140.169 0.895 0.99 0.975 0.95 0.80 0.10 0.05 01025 0.01 01005 Area to the Right of the Critical Value Degrees of Freedom 0- 1 Confidence Interval or hypothesis test for a standard deviation . or variance off * - 1 Goodness-of-it with * categories (r - 1) (6 - 1) Contingency table with / rows and ccolumns * - 1 Kruskal-Wallis test with *samplesUse the given information to find the number of degrees of freedom, the critical values y and y , and the confidence interval estimate of o. It is reasonable to assume that a simple random sample has been selected from a population with a normal distribution. Nicotine in menthol cigarettes 95% confidence; n = 27, s= 0.23 mg. - X i Area to the right of the critical value Click the icon to view the table of Chi-Square critical values. df = (Type a whole number.) Area to the Right of the Critical Value Degrees of Degrees of 0.06 0.025 0.01 0.005 Freedom x2 = (Round to three decimal places as needed.) Freedom 0.895 0.99 0.975 0.95 0.90 0.10 7.879 0.001 0.004 0.016 2.706 3.841 5.024 6.635 9 210 10.597 2 0.010 0.020 0.051 0.103 0.211 .60 5.991 7.37 XR =(Round to three decimal places as needed.) 11.345 12.838 0.072 0.115 0.216 0.352 0.58 6.251 7.815 9.348 0.48 0.711 1.08 7.779 9.486 11.143 13.277 14.860 The confidence interval estimate of o is | | mg