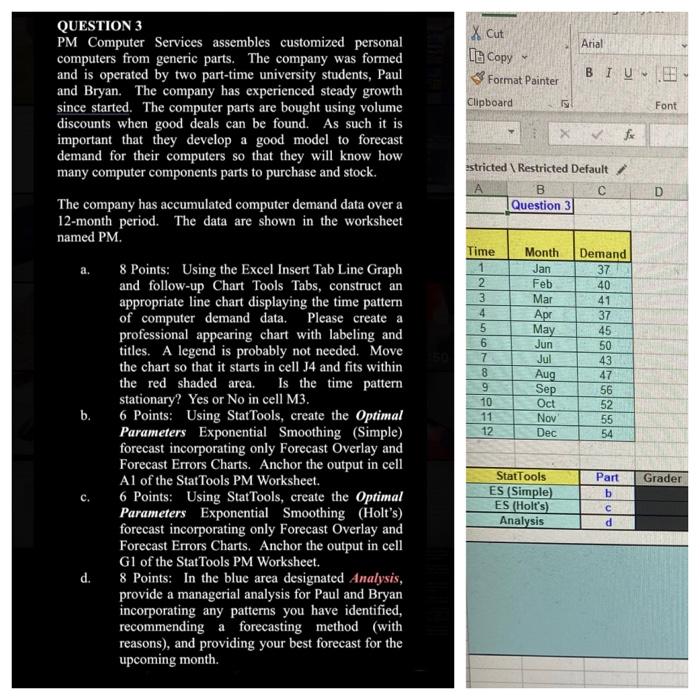
Arial X Cut LCopy Format Painter BIU Clipboard Font QUESTION 3 PM Computer Services assembles customized personal computers from generic parts. The company was formed and is operated by two part-time university students, Paul and Bryan. The company has experienced steady growth since started. The computer parts are bought using volume discounts when good deals can be found. As such it is important that they develop a good model to forecast demand for their computers so that they will know how many computer components parts to purchase and stock. The company has accumulated computer demand data over a 12-month period. The data are shown in the worksheet named PM. estricted Restricted Default A B Question 31 D Time 1 WN- Month Jan Feb Mar 4 5 6 7 8 9 10 11 12 Apr May Jun Jul Aug Sep Oct Nov Dec Demand 37 40 41 37 45 50 43 47 56 52 55 54 a. 8 Points: Using the Excel Insert Tab Line Graph and follow-up Chart Tools Tabs, construct an appropriate line chart displaying the time pattern of computer demand data. Please create a professional appearing chart with labeling and titles. A legend is probably not needed. Move the chart so that it starts in cell J4 and fits within the red shaded area. Is the time pattern stationary? Yes or No in cell M3. b. 6 Points: Using StatTools, create the Optimal Parameters Exponential Smoothing (Simple) forecast incorporating only Forecast Overlay and Forecast Errors Charts. Anchor the output in cell Al of the Stat Tools PM Worksheet. 6 Points: Using StatTools, create the optimal Parameters Exponential Smoothing (Holt's) forecast incorporating only Forecast Overlay and Forecast Errors Charts. Anchor the output in cell G1 of the Stat Tools PM Worksheet. d. 8 Points: In the blue area designated Analysis, provide a managerial analysis for Paul and Bryan incorporating any patterns you have identified, recommending a forecasting method (with reasons), and providing your best forecast for the upcoming month. Grader StatTools ES (Simple) ES (Holt's) Analysis Part b d Arial X Cut LCopy Format Painter BIU Clipboard Font QUESTION 3 PM Computer Services assembles customized personal computers from generic parts. The company was formed and is operated by two part-time university students, Paul and Bryan. The company has experienced steady growth since started. The computer parts are bought using volume discounts when good deals can be found. As such it is important that they develop a good model to forecast demand for their computers so that they will know how many computer components parts to purchase and stock. The company has accumulated computer demand data over a 12-month period. The data are shown in the worksheet named PM. estricted Restricted Default A B Question 31 D Time 1 WN- Month Jan Feb Mar 4 5 6 7 8 9 10 11 12 Apr May Jun Jul Aug Sep Oct Nov Dec Demand 37 40 41 37 45 50 43 47 56 52 55 54 a. 8 Points: Using the Excel Insert Tab Line Graph and follow-up Chart Tools Tabs, construct an appropriate line chart displaying the time pattern of computer demand data. Please create a professional appearing chart with labeling and titles. A legend is probably not needed. Move the chart so that it starts in cell J4 and fits within the red shaded area. Is the time pattern stationary? Yes or No in cell M3. b. 6 Points: Using StatTools, create the Optimal Parameters Exponential Smoothing (Simple) forecast incorporating only Forecast Overlay and Forecast Errors Charts. Anchor the output in cell Al of the Stat Tools PM Worksheet. 6 Points: Using StatTools, create the optimal Parameters Exponential Smoothing (Holt's) forecast incorporating only Forecast Overlay and Forecast Errors Charts. Anchor the output in cell G1 of the Stat Tools PM Worksheet. d. 8 Points: In the blue area designated Analysis, provide a managerial analysis for Paul and Bryan incorporating any patterns you have identified, recommending a forecasting method (with reasons), and providing your best forecast for the upcoming month. Grader StatTools ES (Simple) ES (Holt's) Analysis Part b d