Answered step by step
Verified Expert Solution
Question
1 Approved Answer
arks] It's always been a very competitive industry.' explained Jim Holton. 'We find ourselves going head-to- head against Boggins and Neilsens in virtually every


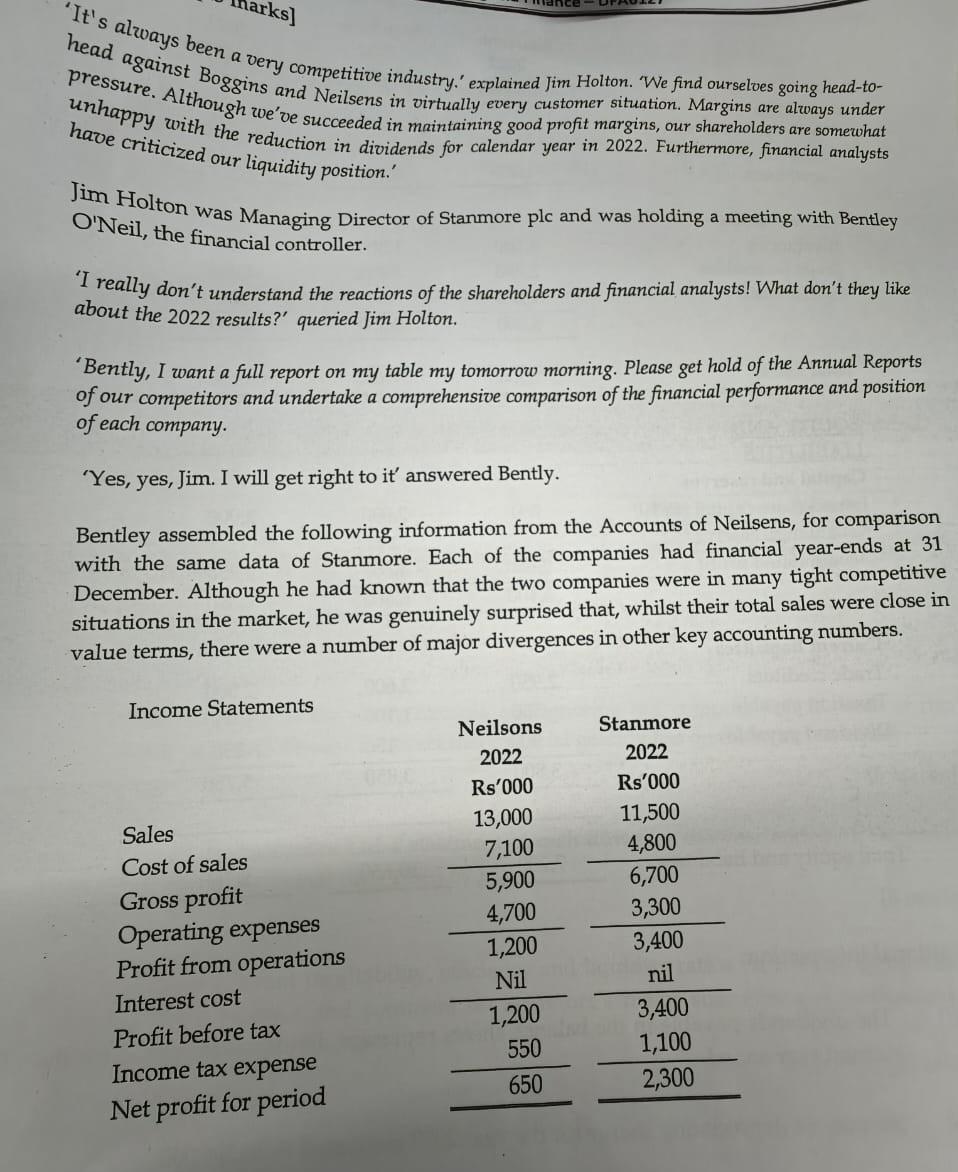
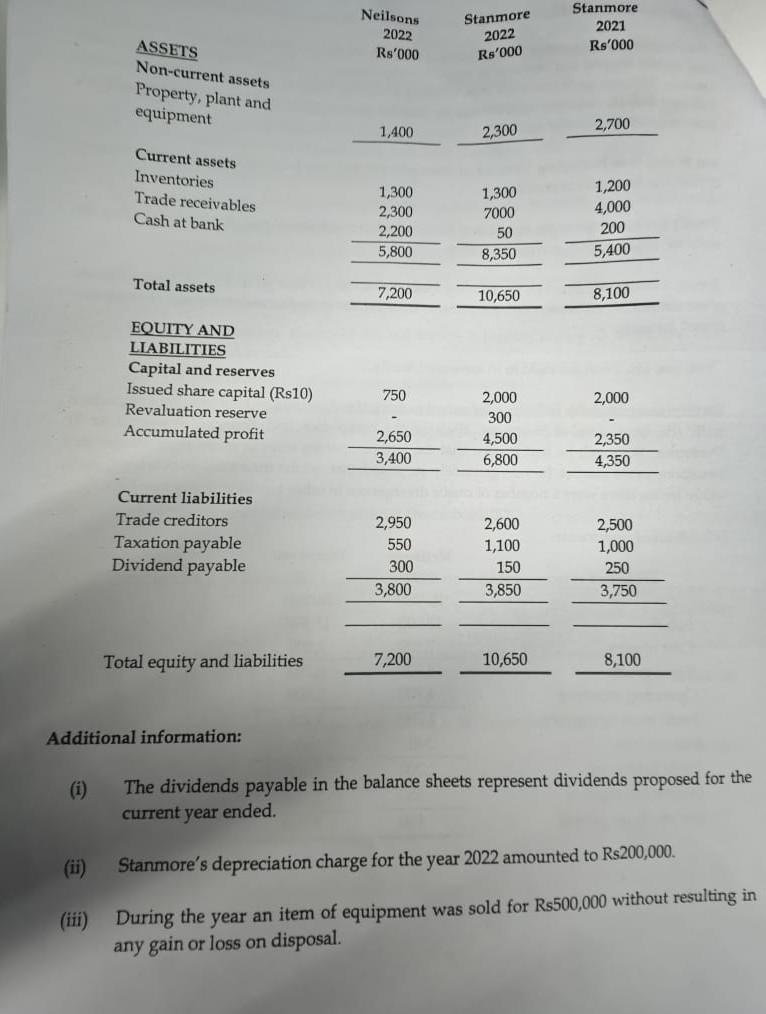
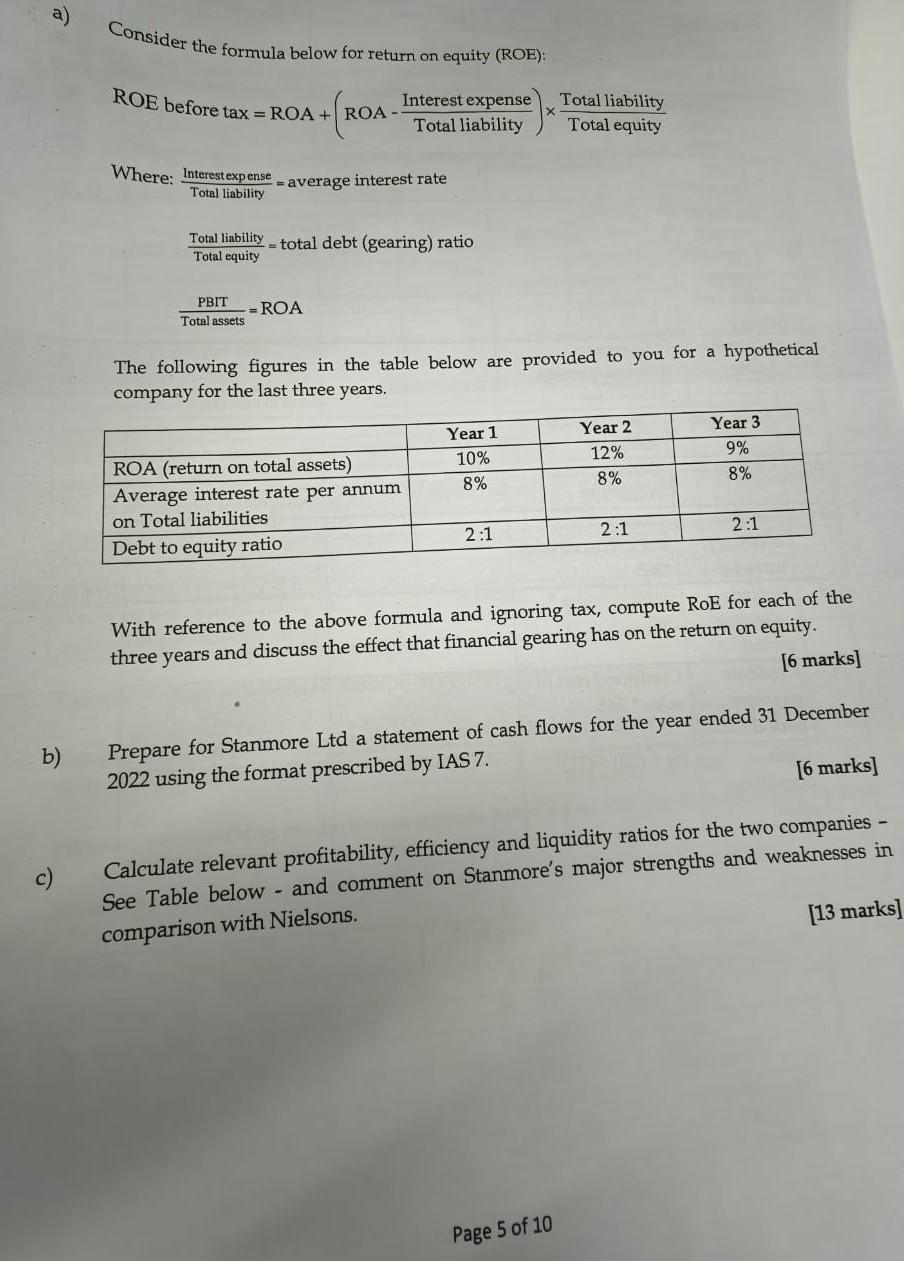
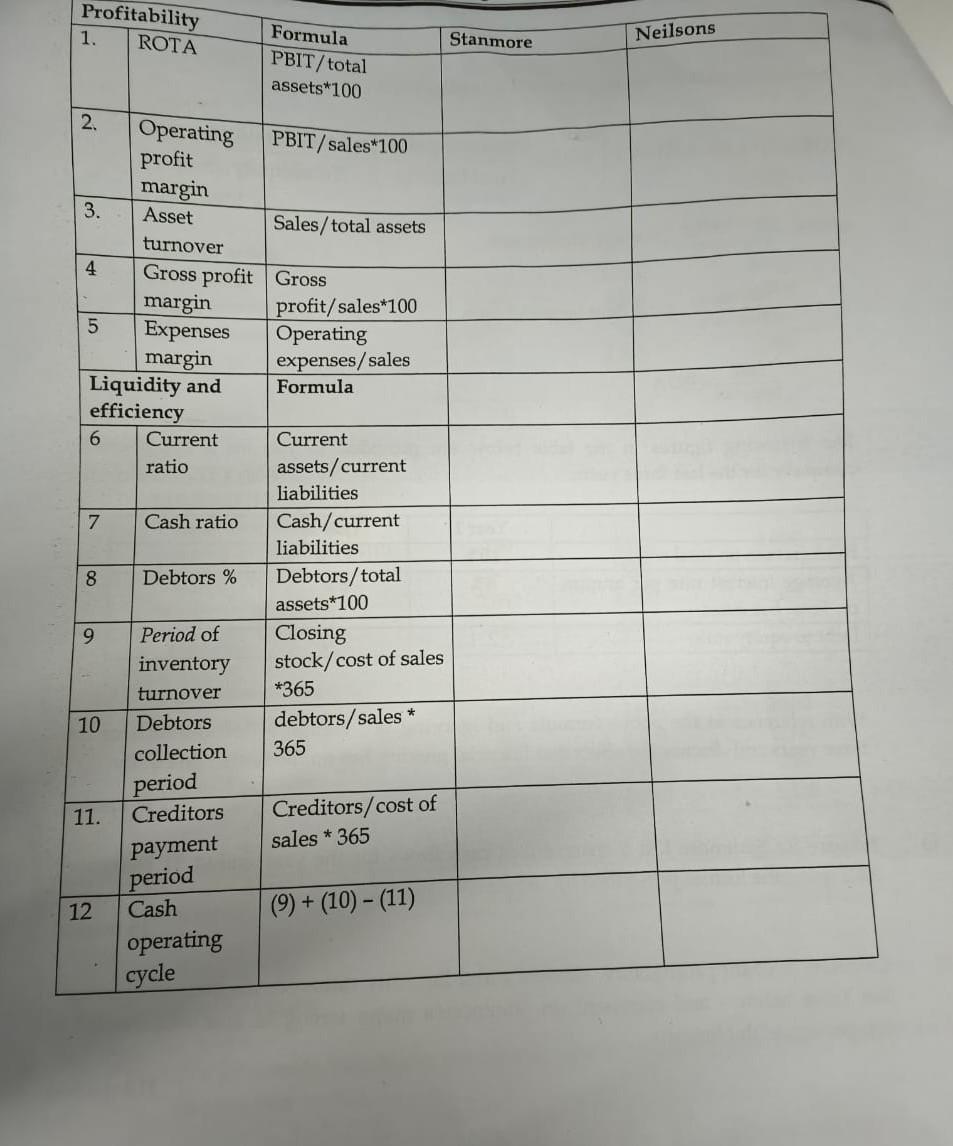
arks] "It's always been a very competitive industry.' explained Jim Holton. 'We find ourselves going head-to- head against Boggins and Neilsens in virtually every customer situation. Margins are always under pressure. Although we've succeeded in maintaining good profit margins, our shareholders are somewhat unhappy with the reduction in dividends for calendar year in 2022. Furthermore, financial analysts have criticized our liquidity position.' Jim Holton was Managing Director of Stanmore plc and was holding a meeting with Bentley O'Neil, the financial controller. 'I really don't understand the reactions of the shareholders and financial analysts! What don't they like about the 2022 results?' queried Jim Holton. 'Bently, I want a full report on my table my tomorrow morning. Please get hold of the Annual Reports of our competitors and undertake a comprehensive comparison of the financial performance and position of each company. 'Yes, yes, Jim. I will get right to it' answered Bently. Bentley assembled the following information from the Accounts of Neilsens, for comparison with the same data of Stanmore. Each of the companies had financial year-ends at 31 December. Although he had known that the two companies were in many tight competitive situations in the market, he was genuinely surprised that, whilst their total sales were close in value terms, there were a number of major divergences in other key accounting numbers. Income Statements Neilsons Stanmore 2022 2022 Rs'000. Rs'000 Sales 13,000 11,500 Cost of sales 7,100 4,800 Gross profit 5,900 6,700 Operating expenses 4,700 3,300 Profit from operations 1,200 3,400 Interest cost Nil nil Profit before tax 1,200 3,400 Income tax expense 550 1,100 Net profit for period 650 2,300 ASSETS Neilsons Stanmore Stanmore 2022 2022 2021 Rs'000 Rs'000 Rs'000 Non-current assets Property, plant and equipment 2,700 1,400 2,300 Current assets Inventories 1,200 Trade receivables 1,300 1,300 2,300 7000 4,000 Cash at bank 200 2,200 50 5,800 8,350 5,400 7,200 10,650 8,100 Total assets EQUITY AND LIABILITIES Capital and reserves Issued share capital (Rs10) 750 2,000. 2,000 Revaluation reserve 300 - Accumulated profit 2,650 4,500 2,350 3,400 6,800 4,350 Current liabilities Trade creditors 2,950 2,600 2,500 Taxation payable 550 1,100 1,000 Dividend payable 300 150 250 3,800 3,850 3,750 Total equity and liabilities 7,200 10,650 8,100 Additional information: (i) The dividends payable in the balance sheets represent dividends proposed for the current year ended. (ii) (iii) Stanmore's depreciation charge for the year 2022 amounted to Rs200,000. During the year an item of equipment was sold for Rs500,000 without resulting in any gain or loss on disposal. b) c) a) Consider the formula below for return on equity (ROE): ROE before tax = ROA+ ROA- Interest expense Total liability Total equity Total liability Where: Interest expense average interest rate Total liability Total liability total debt (gearing) ratio Total equity PBIT = ROA Total assets The following figures in the table below are provided to you for a hypothetical company for the last three years. Year 1 Year 2 Year 3 ROA (return on total assets) 10% 12% 9% Average interest rate per annum 8% 8% 8% on Total liabilities Debt to equity ratio 2:1 2:1 2:1 With reference to the above formula and ignoring tax, compute RoE for each of the three years and discuss the effect that financial gearing has on the return on equity. [6 marks] Prepare for Stanmore Ltd a statement of cash flows for the year ended 31 December 2022 using the format prescribed by IAS 7. [6 marks] Calculate relevant profitability, efficiency and liquidity ratios for the two companies - See Table below and comment on Stanmore's major strengths and weaknesses in comparison with Nielsons. - Page 5 of 10 [13 marks] Profitability Neilsons Formula Stanmore 1. ROTA PBIT/total assets*100 2. Operating PBIT/sales*100 profit margin 3. Asset Sales/total assets turnover 4 Gross profit Gross margin profit/sales*100 5 Expenses margin Operating expenses/sales Liquidity and efficiency 6 Current ratio Formula Current assets/current liabilities 7 Cash ratio Cash/current liabilities 8 Debtors % Debtors/total assets*100 9 Period of Closing inventory stock/cost of sales turnover *365 10 Debtors debtors/sales * collection 365 period 11. Creditors Creditors/cost of payment sales * 365 period 12 Cash (9) + (10) - (11) operating cycle
Step by Step Solution
There are 3 Steps involved in it
Step: 1

Get Instant Access to Expert-Tailored Solutions
See step-by-step solutions with expert insights and AI powered tools for academic success
Step: 2

Step: 3

Ace Your Homework with AI
Get the answers you need in no time with our AI-driven, step-by-step assistance
Get Started


