As 2013 drew to an end, Michel Kripalani took stock of his journey with Oceanhouse Media, the digital applications company he had founded in 2009. Several of Oceanhouse Media's venturecapital funded competitors had either been acquired at discounted valuations or were restructured within the last 12 months. He wondered if this was an opportune time to consider an appropriate exit strategy for his fiveyearold venture. While he had not considered a sale of Oceanhouse Media, he was now open to the possibility of a sale if the right offer materialized, determined by Oceanhouse Media's estimated worth at yearend 2013. Kripalani saw 2013 as a year of consolidation in the digital apps market; the market was becoming increasingly saturated, highly concentrated, with increasing competitive pressures that were driving app prices toward zero.
QUESTION 1B) Evaluate Oceanhouse Media's exit options at the end of 2013. How would you value Oceanhouse Media at year-end 2013 using COMPS METHOD? WILL LIKE IF WORK IS SHOWN :)
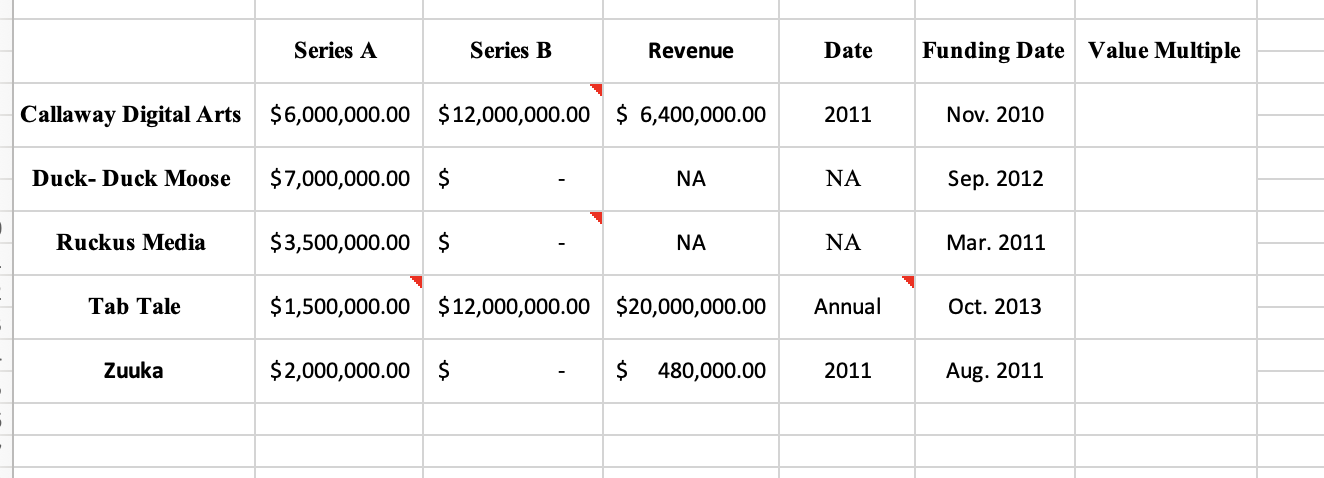
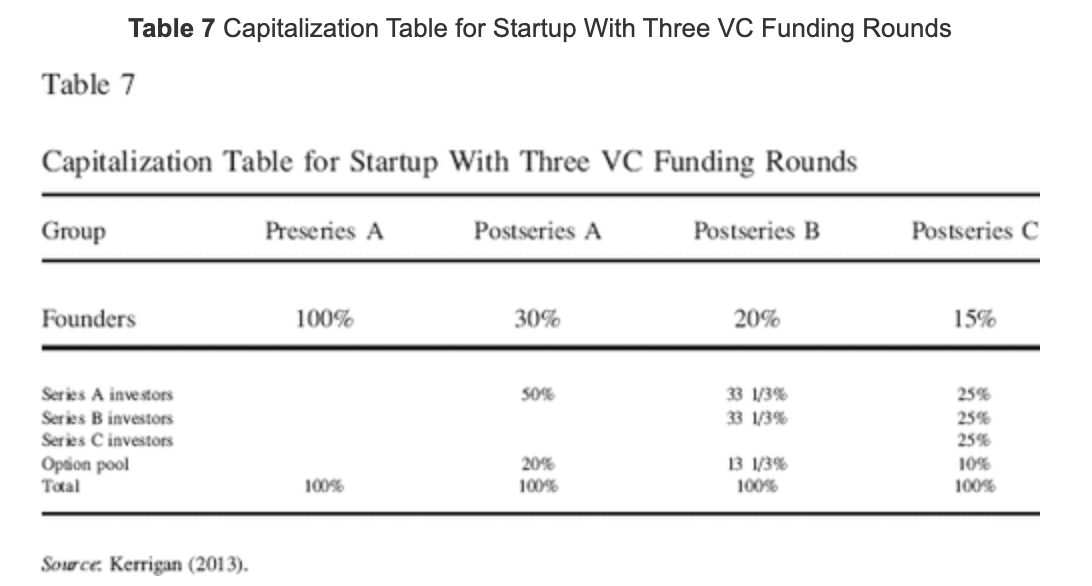
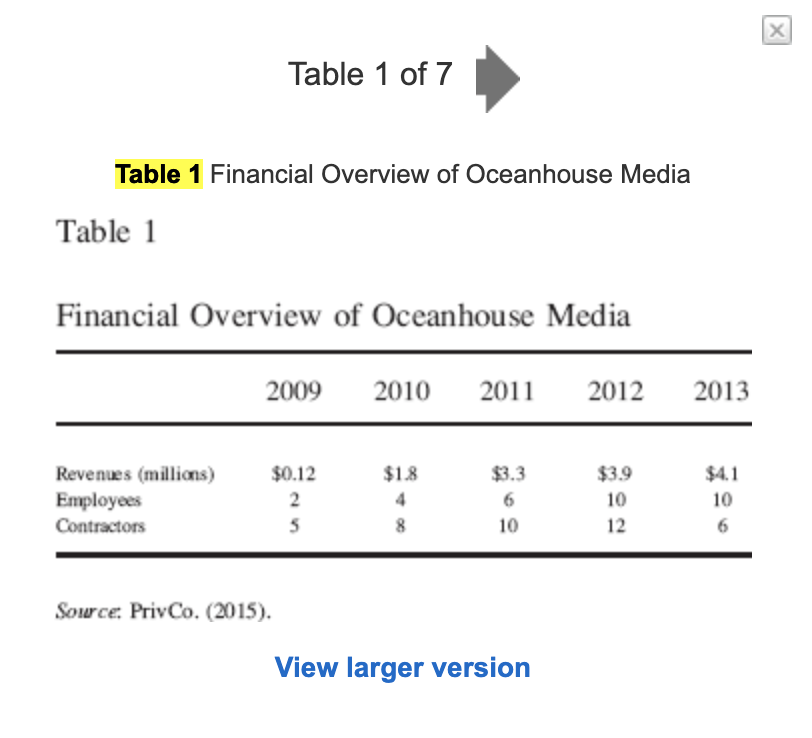
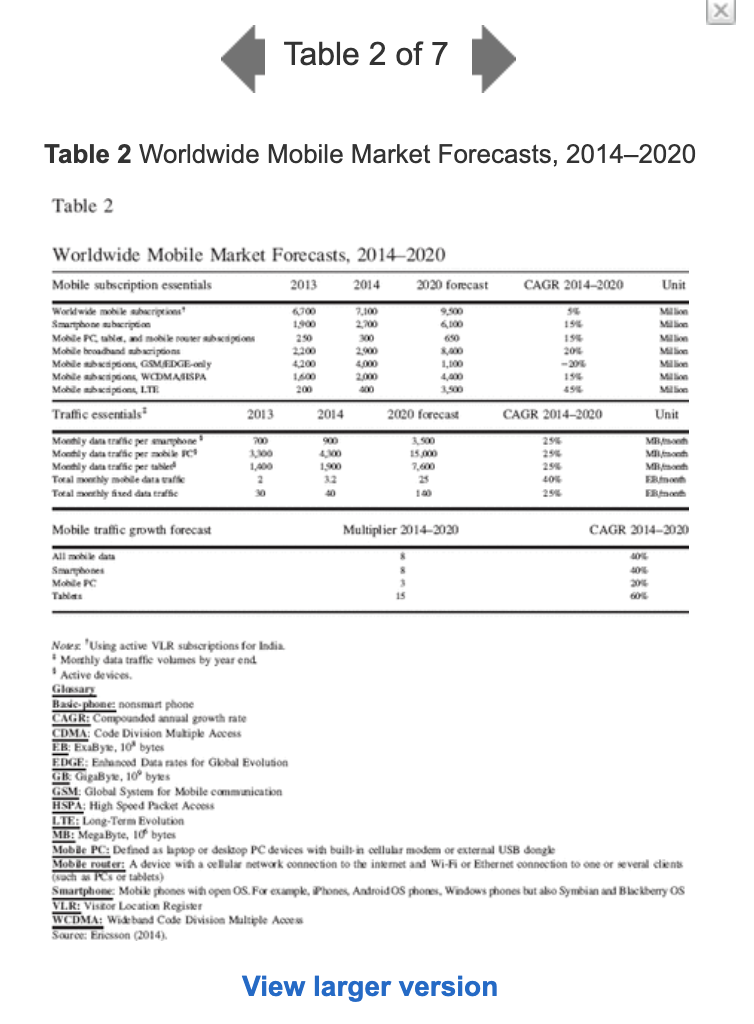
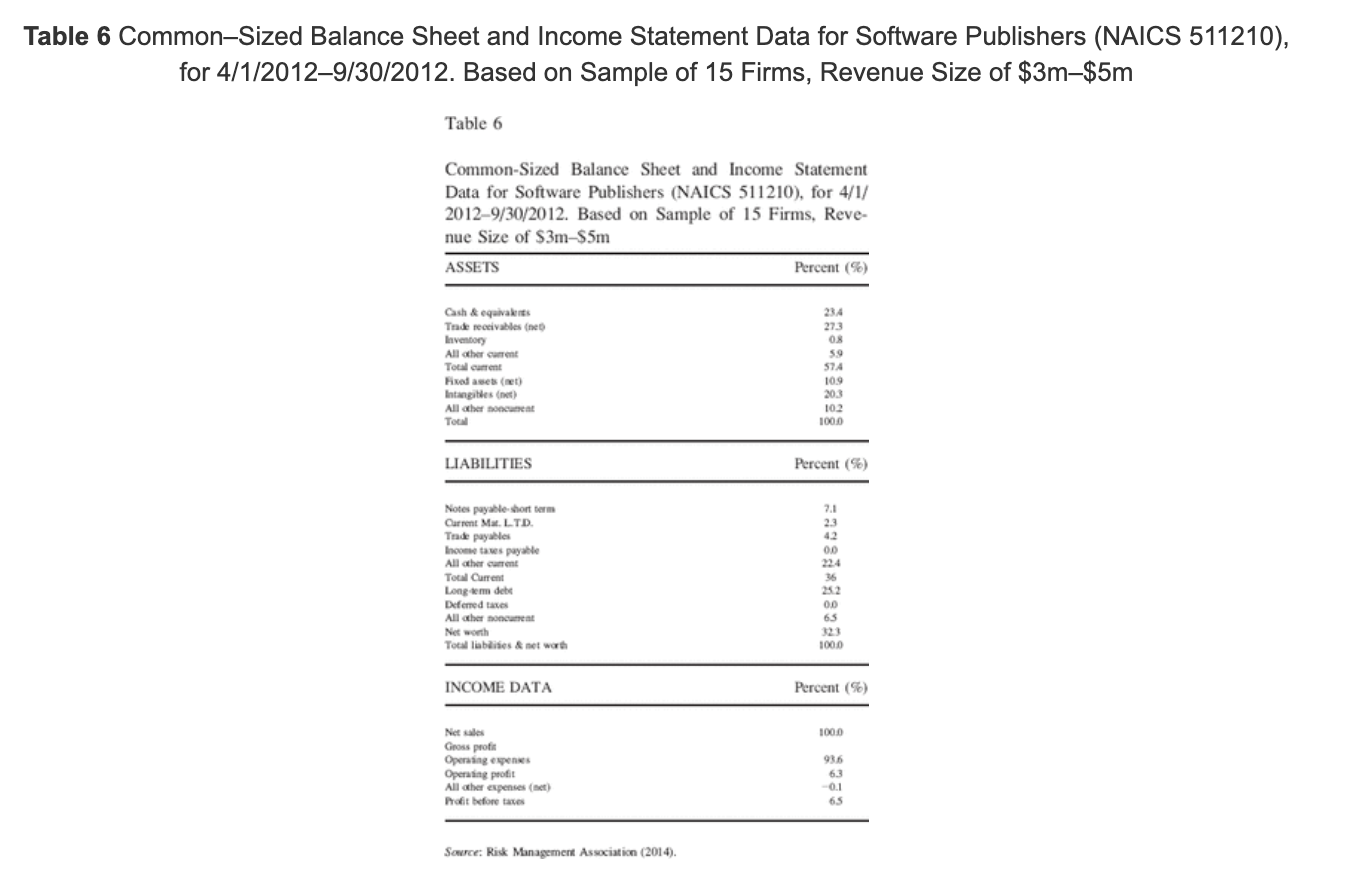
Series A Series B Revenue Date Funding Date Value Multiple Callaway Digital Arts $6,000,000.00 $12,000,000.00 $ 6,400,000.00 2011 Nov. 2010 Duck-Duck Moose $7,000,000.00 $ NA NA Sep. 2012 Ruckus Media $3,500,000.00 $ NA NA Mar. 2011 Tab Tale $1,500,000.00 $ 12,000,000.00 $20,000,000.00 Annual Oct. 2013 Zuuka $2,000,000.00 $ $ 480,000.00 2011 Aug. 2011 Table 7 Capitalization Table for Startup With Three VC Funding Rounds Table 7 Capitalization Table for Startup With Three VC Funding Rounds Group Preseries A Postseries A Postseries B Postseries C Founders 100% 30% 20% 15% SOS 25% 33 1/3% 33 1/3% 25% Series A investors Series B investors Series Cinvestors Option pool Total 25% 20% 100% 13 1/3% 100% 10% 100% 100% Sowce Kerrigan (2013). Table 1 of 7 Table 1 Financial Overview of Oceanhouse Media Table 1 Financial Overview of Oceanhouse Media 2009 2010 2011 2012 2013 $3.9 Revenues (millions) Employees Contractors $0.12 2 5 $1.8 4 8 $3.3 6 10 10 $4.1 10 6 12 Source: PrivCo. (2015). View larger version Table 2 of 7 Table 2 Worldwide Mobile Market Forecasts, 20142020 Table 2 CAGR 2014-2020 Unit Worldwide Mobile Market Forecasts, 2014-2020 Mobile subscription essentials 2013 2014 2020 forecast Worldwide short 700 7.100 9.500 Smartphone sahiption 2,200 Mobile PC, Na, de 250 VO 690 Mohledhud hins 2.000 R600 Mobile, GAMEXE 4200 1,100 Mohle bons, WCDMATSPA 2.000 4,00 . 200 3500 Traffic essentials 2013 2014 2020 forecast Monthly date pe carphone! 200 3500 Monthly data trafic 10 40 15 000 Monthly data per le 1.900 2.600 Torally mobile data alle 2 12 25 Totally fired data tathic V 196 15 200 -200 190 496 M Milli Unit CAGR 2014-2020 296 296 2990 20 296 M Moh Moth FR ER Mobile traffic growth forecast Multiplier 2014-2020 CAGR 2014-2020 All Shoes Mobile PC Talas 2006 Nors 'Using active VLR subscriptions for India Monthly data traffie volumes by year end. Active devices Glossary Base phone nonsmart phone GAGR: Compounded annual growth rate CDMA: Code Division Multiple Access EB. ExaBy, 109 bytes EDGE Enhanced Data rates for Global Evolution GB GigaByx, 10 bytes GSM: Global System for Mobile communication HSPA: High Speed Packet Access LTE: Long-Term Evolution MB: MegaByte, 1 bytes Mobile PC: Defined as lapoop or desktop PC devices with built-in cellular modem or external USB dongle Moble router: A device with a cellular network connection to the inte met and Wi-Fi or Ethernet connection to one or several dients sach Resor tablets) Smartphone Mobile phones with open OS. For example, iPhone, Android OS phones, Windows phones but also Symbian and Blackberry OS VIR: Vis. Or Location Register WCDMA: Wideband Code Division Multiple Access Source: Ericsson (2014) View larger version Table 6 Common-Sized Balance Sheet and Income Statement Data for Software Publishers (NAICS 511210), for 4/1/20129/30/2012. Based on Sample of 15 Firms, Revenue Size of $3m-$5m Table 6 6 Common-Sized Balance Sheet and Income Statement Data for Software Publishers (NAICS 511210), for 4/1/ 2012-9/30/2012. Based on Sample of 15 Firms, Reve- nue Size of S3m-S5m ASSETS Percent (%) Cash & equivaks Trade elvables (neo Inventory All other current Tocal current Fredases (et) Intangibles (net) All other soncurrent Total 234 273 0.8 59 S7A 109 203 102 1000 LIABILITIES Percent (5) 2.1 23 Notes payable short term Current M. LTD. Trade payables Income taxes payable All other current Tocal Current Long term debe Deferred taxes All other one Net worth Tocal liabides & net worth 00 224 36 252 00 65 323 1000 INCOME DATA Percent (%) 1000 Net als Gross proti Operating expenses Operating profit All other expenses (het) Profit before taces 936 63 -0.1 65 Source: Risk Management Association (2014). Series A Series B Revenue Date Funding Date Value Multiple Callaway Digital Arts $6,000,000.00 $12,000,000.00 $ 6,400,000.00 2011 Nov. 2010 Duck-Duck Moose $7,000,000.00 $ NA NA Sep. 2012 Ruckus Media $3,500,000.00 $ NA NA Mar. 2011 Tab Tale $1,500,000.00 $ 12,000,000.00 $20,000,000.00 Annual Oct. 2013 Zuuka $2,000,000.00 $ $ 480,000.00 2011 Aug. 2011 Table 7 Capitalization Table for Startup With Three VC Funding Rounds Table 7 Capitalization Table for Startup With Three VC Funding Rounds Group Preseries A Postseries A Postseries B Postseries C Founders 100% 30% 20% 15% SOS 25% 33 1/3% 33 1/3% 25% Series A investors Series B investors Series Cinvestors Option pool Total 25% 20% 100% 13 1/3% 100% 10% 100% 100% Sowce Kerrigan (2013). Table 1 of 7 Table 1 Financial Overview of Oceanhouse Media Table 1 Financial Overview of Oceanhouse Media 2009 2010 2011 2012 2013 $3.9 Revenues (millions) Employees Contractors $0.12 2 5 $1.8 4 8 $3.3 6 10 10 $4.1 10 6 12 Source: PrivCo. (2015). View larger version Table 2 of 7 Table 2 Worldwide Mobile Market Forecasts, 20142020 Table 2 CAGR 2014-2020 Unit Worldwide Mobile Market Forecasts, 2014-2020 Mobile subscription essentials 2013 2014 2020 forecast Worldwide short 700 7.100 9.500 Smartphone sahiption 2,200 Mobile PC, Na, de 250 VO 690 Mohledhud hins 2.000 R600 Mobile, GAMEXE 4200 1,100 Mohle bons, WCDMATSPA 2.000 4,00 . 200 3500 Traffic essentials 2013 2014 2020 forecast Monthly date pe carphone! 200 3500 Monthly data trafic 10 40 15 000 Monthly data per le 1.900 2.600 Torally mobile data alle 2 12 25 Totally fired data tathic V 196 15 200 -200 190 496 M Milli Unit CAGR 2014-2020 296 296 2990 20 296 M Moh Moth FR ER Mobile traffic growth forecast Multiplier 2014-2020 CAGR 2014-2020 All Shoes Mobile PC Talas 2006 Nors 'Using active VLR subscriptions for India Monthly data traffie volumes by year end. Active devices Glossary Base phone nonsmart phone GAGR: Compounded annual growth rate CDMA: Code Division Multiple Access EB. ExaBy, 109 bytes EDGE Enhanced Data rates for Global Evolution GB GigaByx, 10 bytes GSM: Global System for Mobile communication HSPA: High Speed Packet Access LTE: Long-Term Evolution MB: MegaByte, 1 bytes Mobile PC: Defined as lapoop or desktop PC devices with built-in cellular modem or external USB dongle Moble router: A device with a cellular network connection to the inte met and Wi-Fi or Ethernet connection to one or several dients sach Resor tablets) Smartphone Mobile phones with open OS. For example, iPhone, Android OS phones, Windows phones but also Symbian and Blackberry OS VIR: Vis. Or Location Register WCDMA: Wideband Code Division Multiple Access Source: Ericsson (2014) View larger version Table 6 Common-Sized Balance Sheet and Income Statement Data for Software Publishers (NAICS 511210), for 4/1/20129/30/2012. Based on Sample of 15 Firms, Revenue Size of $3m-$5m Table 6 6 Common-Sized Balance Sheet and Income Statement Data for Software Publishers (NAICS 511210), for 4/1/ 2012-9/30/2012. Based on Sample of 15 Firms, Reve- nue Size of S3m-S5m ASSETS Percent (%) Cash & equivaks Trade elvables (neo Inventory All other current Tocal current Fredases (et) Intangibles (net) All other soncurrent Total 234 273 0.8 59 S7A 109 203 102 1000 LIABILITIES Percent (5) 2.1 23 Notes payable short term Current M. LTD. Trade payables Income taxes payable All other current Tocal Current Long term debe Deferred taxes All other one Net worth Tocal liabides & net worth 00 224 36 252 00 65 323 1000 INCOME DATA Percent (%) 1000 Net als Gross proti Operating expenses Operating profit All other expenses (het) Profit before taces 936 63 -0.1 65 Source: Risk Management Association (2014)