Answered step by step
Verified Expert Solution
Link Copied!

Question

1 Approved Answer

As a data analyst, you are tasked to explain the differences and relationship between two key website metrics: traffic (number of visits, measured in million)

As a data analyst, you are tasked to explain the differences and relationship between two key website metrics: traffic (number of visits, measured in million) and conversion (number of purchase orders, measured in million). Assume that you have collected data on a sample of 30 e-commerce companies in Malaysia for the month of October 2023, as shown in the following table:\ \\\\table[[E-commerce website,\\\\table[[Number of visits],[(in million)]],\\\\table[[Number of purchase orders],[(in million)]]],[Lazada,53.8,199.4],[Shopee,54.2,231.9],[Mudah,45.1,197.2],[PrestoMall,32.0,127.8],[Lelong,48.7,163.3],[Hermo,46.4,117.2],[Zalora,49.3,206.3],[Carousell,23.7,139.1],[Ezbuy,24.4,138.0],[Ebay,40.0,185.1],[Shopify,31.7,124.4],[Taobao,33.3,155.4],[Qoo10,34.1,164.5],[Harvey Norman,32.6,168.8],[Signature Market,28.9,116.5],[Sephora,41.8,152.1],[Go Shop,47.3,210.3],[PG Mall,23.0,182.8],[YouBeli,31.8,162.0],[Kravve,34.9,140.3],[Mr DIY,40.9,178.6],[JD Sports,49.8,208.7],[Shein,32.1,126.2],[Padini,34.1,143.4],[Sasa,42.8,198.6],[Watsons,41.9,211.9],[iHerb,30.5,155.0],[Senheng,33.0,159.0],[Althea,33.6,167.9],[BookXcess,35.7,172.8]]\ INSTRUCTION\ Based on the sample information above, perform the following descriptive analytics and interpret your findings:\ \ Part5: Calculate and interpret measures of association between the two metrics
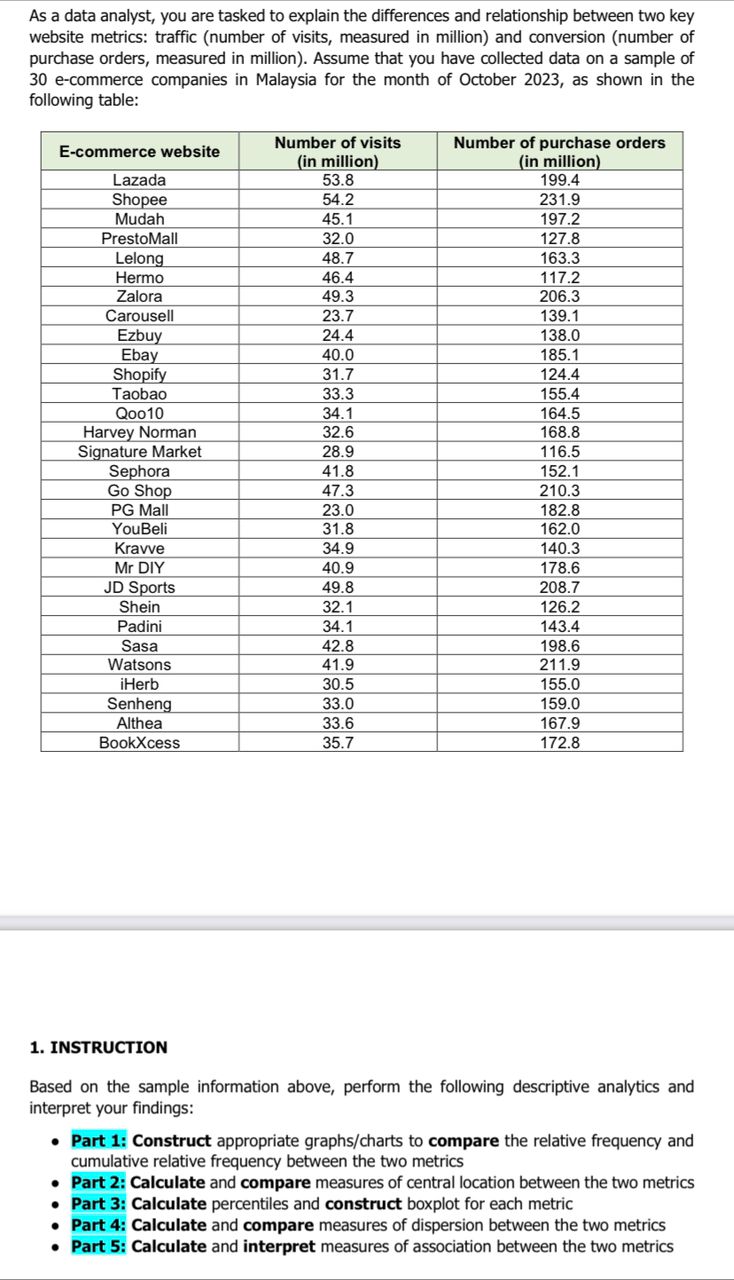
image text in transcribed
As a data analyst, you are tasked to explain the differences and relationship between two key website metrics: traffic (number of visits, measured in million) and conversion (number of purchase orders, measured in million). Assume that you have collected data on a sample of 30 e-commerce companies in Malaysia for the month of October 2023, as shown in the following table: 1. INSTRUCTION Based on the sample information above, perform the following descriptive analytics and interpret your findings: - Part 1: Construct appropriate graphs/charts to compare the relative frequency and cumulative relative frequency between the two metrics - Part 2: Calculate and compare measures of central location between the two metrics - Part 3: Calculate percentiles and construct boxplot for each metric - Part 4: Calculate and compare measures of dispersion between the two metrics - Part 5: Calculate and interpret measures of association between the two metrics As a data analyst, you are tasked to explain the differences and relationship between two key website metrics: traffic (number of visits, measured in million) and conversion (number of purchase orders, measured in million). Assume that you have collected data on a sample of 30 e-commerce companies in Malaysia for the month of October 2023, as shown in the following table: 1. INSTRUCTION Based on the sample information above, perform the following descriptive analytics and interpret your findings: - Part 1: Construct appropriate graphs/charts to compare the relative frequency and cumulative relative frequency between the two metrics - Part 2: Calculate and compare measures of central location between the two metrics - Part 3: Calculate percentiles and construct boxplot for each metric - Part 4: Calculate and compare measures of dispersion between the two metrics - Part 5: Calculate and interpret measures of association between the two metrics

Step by Step Solution

There are 3 Steps involved in it

Step: 1

blur-text-image

Get Instant Access to Expert-Tailored Solutions

See step-by-step solutions with expert insights and AI powered tools for academic success

Step: 2

blur-text-image

Step: 3

blur-text-image

Ace Your Homework with AI

Get the answers you need in no time with our AI-driven, step-by-step assistance

Get Started

Recommended Textbook for

Database Driven Web Sites

Authors: Joline Morrison, Mike Morrison

2nd Edition

? 061906448X, 978-0619064488

More Books

Students also viewed these Databases questions

Question

What do Dimensions represent in OLAP Cubes?

Answered: 1 week ago