Answered step by step
Verified Expert Solution
Question
1 Approved Answer
As a financial analyst, one of your long-term clients recently contacted you. His daughter has just graduated from MRU and he has given her


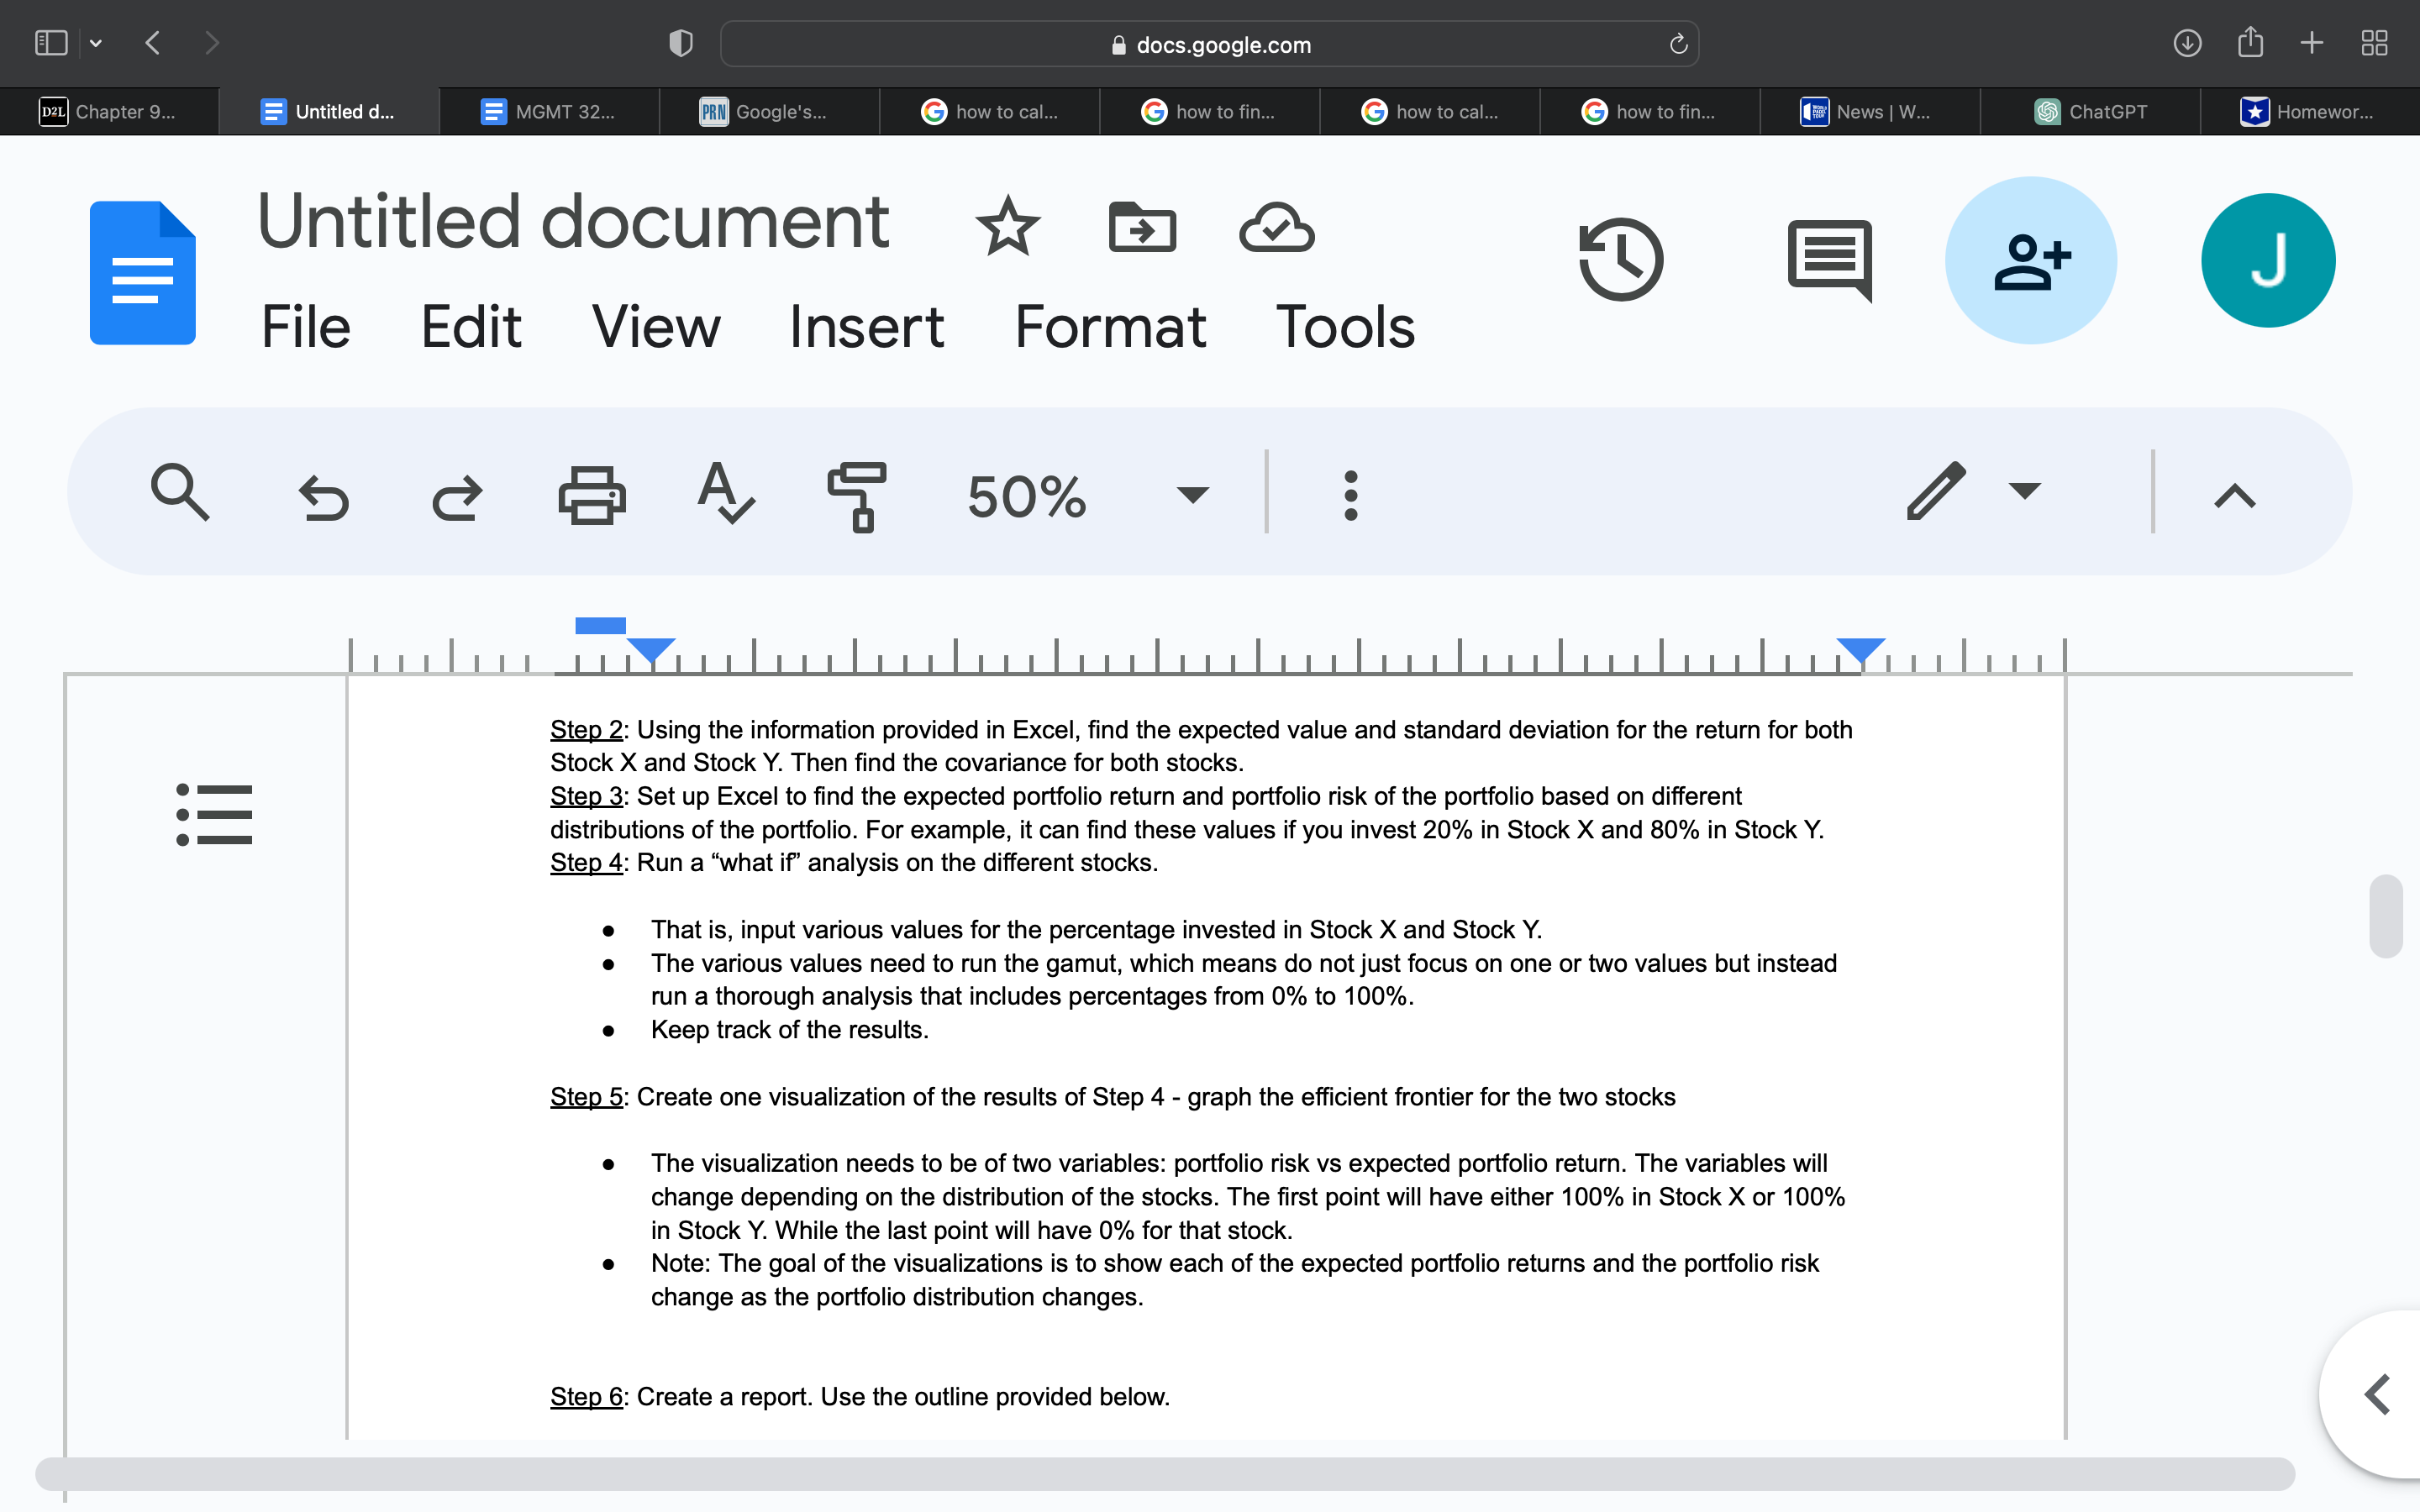
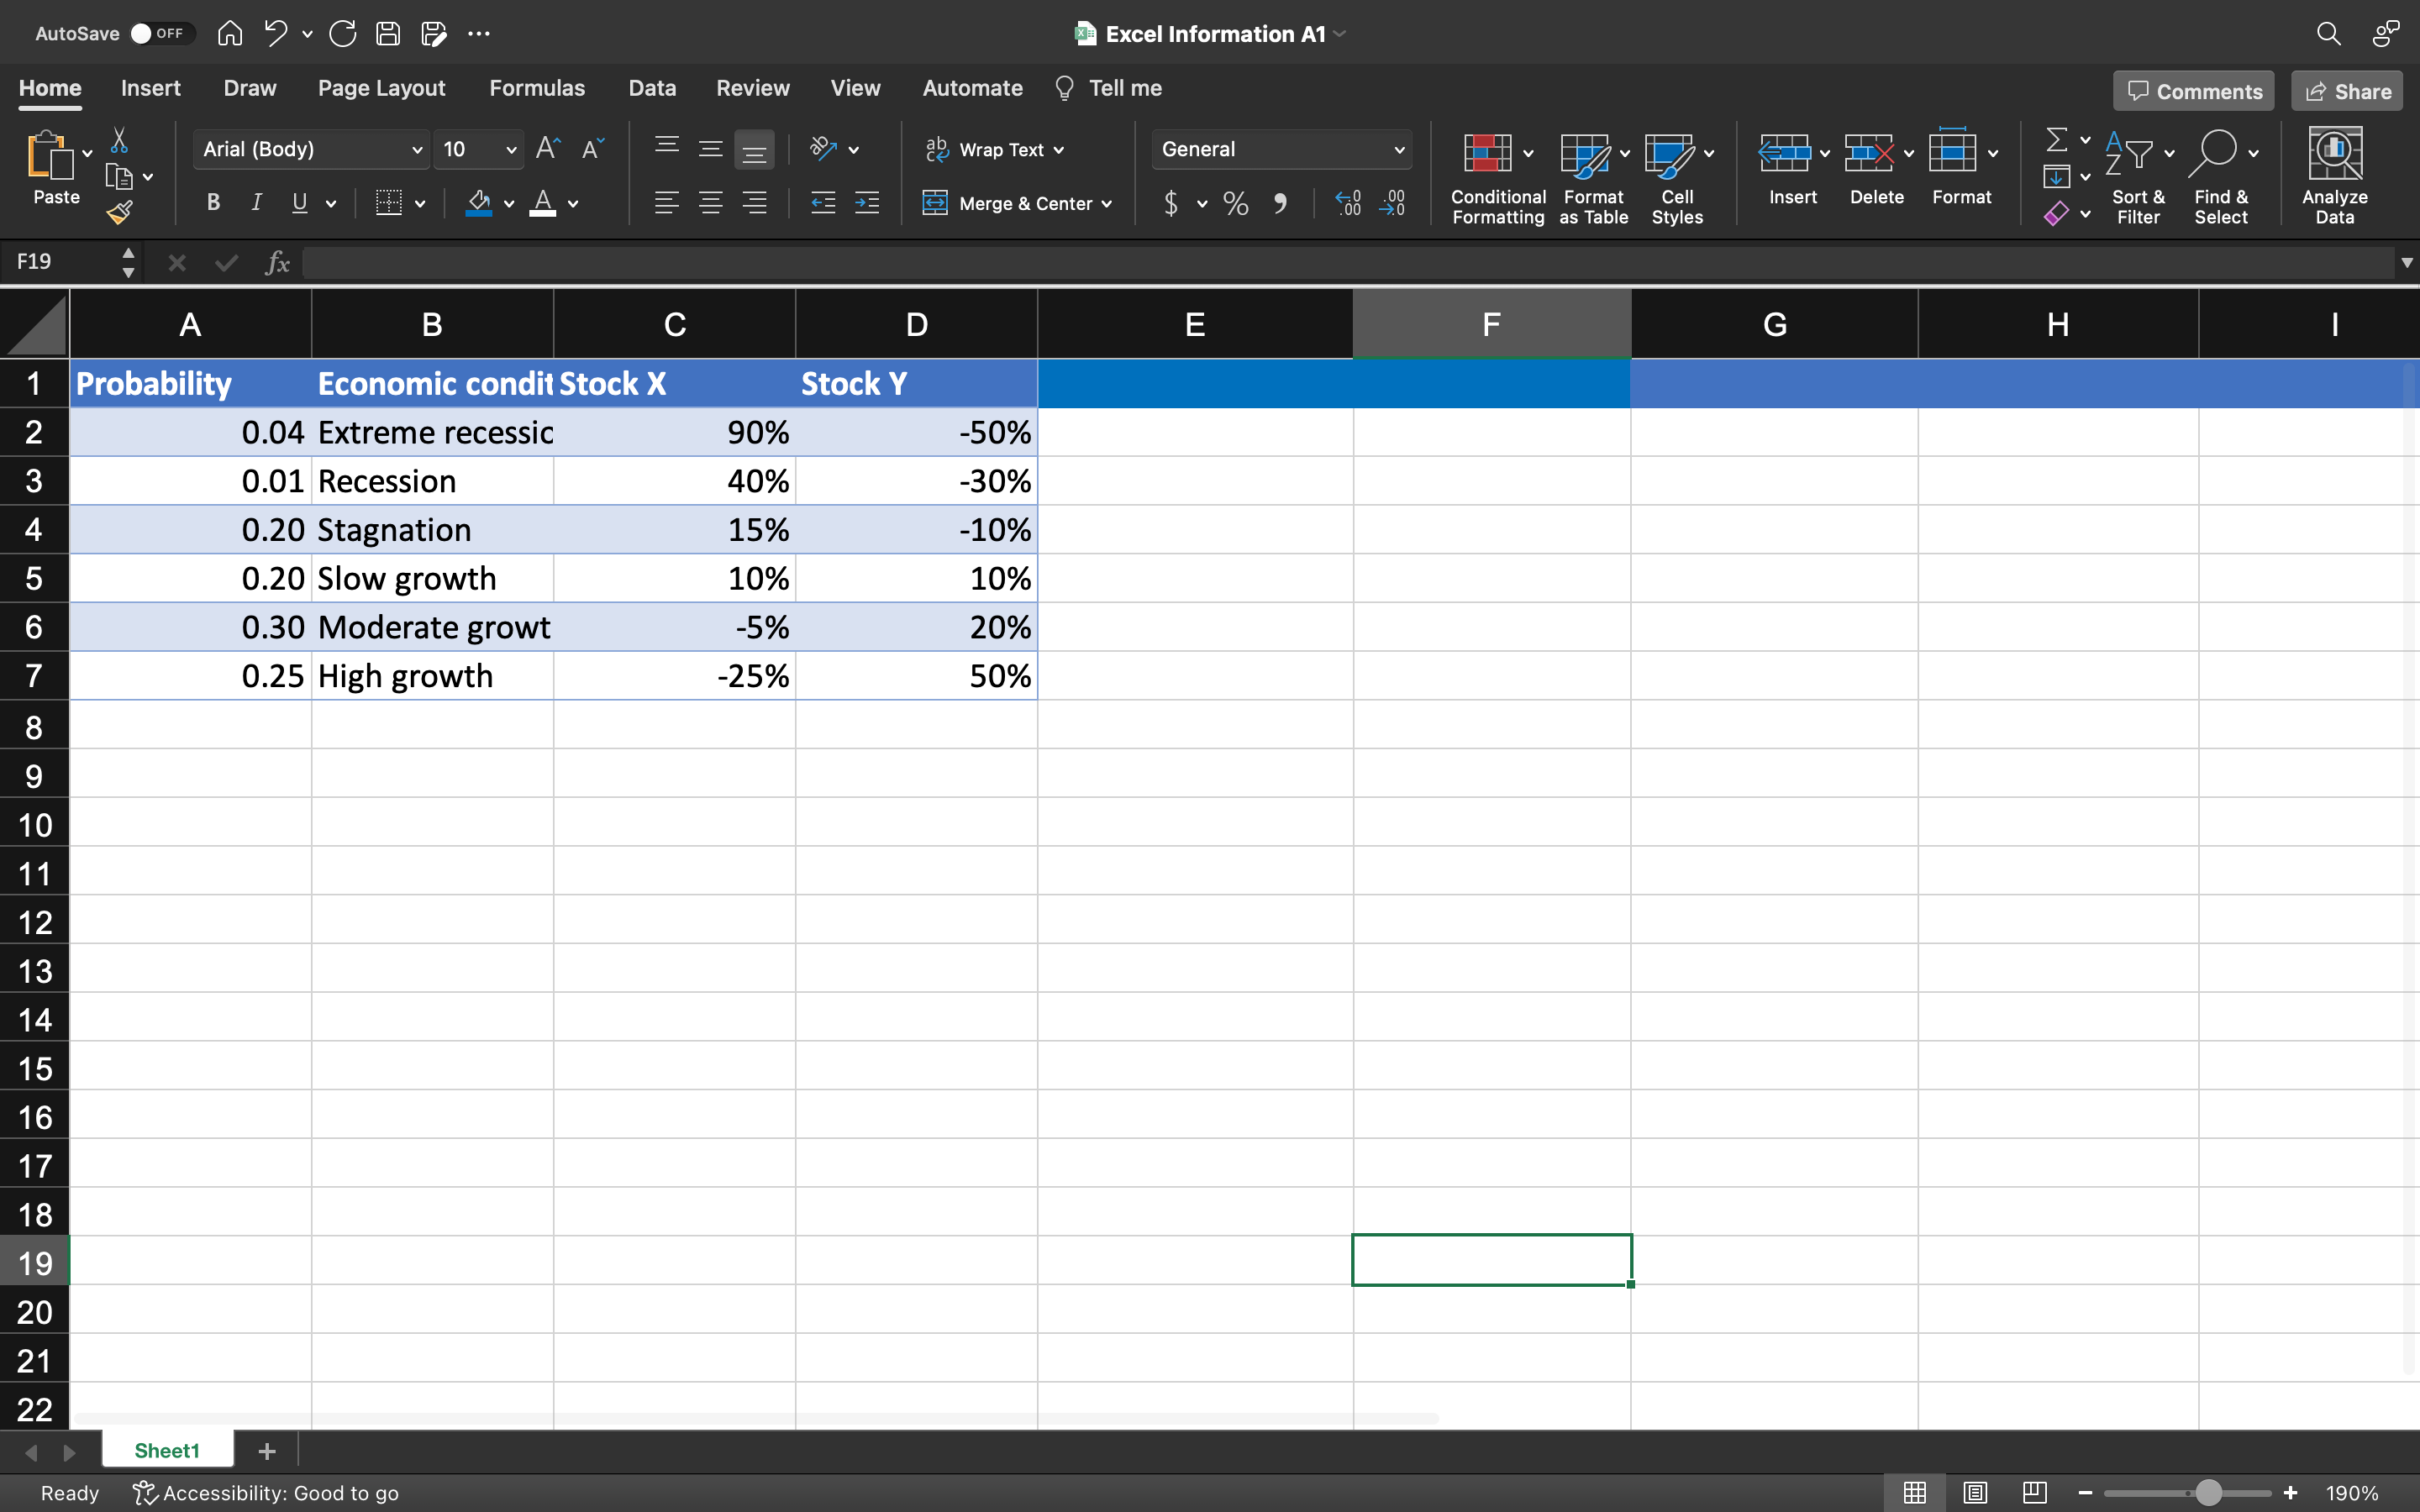
As a financial analyst, one of your long-term clients recently contacted you. His daughter has just graduated from MRU and he has given her a gift of $10000 to invest. After the father and daughter spoke at length, they decided to invest her money in two stocks: Stock X and Stock Y. Based on the promising look of both stocks, the father has also decided to invest $15000 in both stocks. The father has been your client for the last five years and he is a civil engineer. He has worked for the City of Calgary for the last twenty years and is getting close to retirement. Each year, you and he have long conversations about how his investments are doing. In these conversations, the father has shown a good understanding of financial planning. As he is nearing retirement, he has moved his investments to low-risk portfolios. You have not met the daughter yet, but the father has spoken about her a lot. From those conversations, you know that she graduated with a major in HR and took FNCE 2130 early in her degree in addition to her core finance course. She seems to have a solid understanding of investments. As she is just starting, she is more interested in making money on her investments and is willing to take greater risks than her dad. The reason they have approached you is to get advice on how much they should invest in each stock. Initially, they thought they would put 50% of their investment into each stock, but now they are uncertain if that is the best plan. You have agreed to provide them with an overview of each stock and an in-depth analysis to help them make their decision. Follow the steps below to create a report for both the father and daughter where you outline your advice and support it with evidence. Step 0: Read all the steps first so you know what is coming. Then do step 1. > D2L Chapter 9... !!! docs.google.com Untitled d... MGMT 32... PRN Google's... G how to cal... how to fin... how to cal... Ghow to fin... News | W... Untitled document Insert Format Tools File Edit View < > A 50% D Step 2: Using the information provided in Excel, find the expected value and standard deviation for the return for both Stock X and Stock Y. Then find the covariance for both stocks. Step 3: Set up Excel to find the expected portfolio return and portfolio risk of the portfolio based on different distributions of the portfolio. For example, it can find these values if you invest 20% in Stock X and 80% in Stock Y. Step 4: Run a "what if" analysis on the different stocks. That is, input various values for the percentage invested in Stock X and Stock Y. The various values need to run the gamut, which means do not just focus on one or two values but instead run a thorough analysis that includes percentages from 0% to 100%. Keep track of the results. Step 5: Create one visualization of the results of Step 4 - graph the efficient frontier for the two stocks The visualization needs to be of two variables: portfolio risk vs expected portfolio return. The variables will change depending on the distribution of the stocks. The first point will have either 100% in Stock X or 100% in Stock Y. While the last point will have 0% for that stock. Note: The goal of the visualizations is to show each of the expected portfolio returns and the portfolio risk change as the portfolio distribution changes. Step 6: Create a report. Use the outline provided below. +0 ChatGPT ^ r (+ J Homewor... AutoSave OFF 2. C S Excel Information A1 Tell me General Wrap Text Merge & Center $ % 9 .00 Home Insert Draw Page Layout G X Arial (Body) Formulas Data Review View Automate 10 Paste B I U F19 fx A B C D 1 Probability Economic condit Stock X Stock Y 2 0.04 Extreme recessic 90% -50% 3 0.01 Recession 40% -30% 4 0.20 Stagnation 15% -10% 5 0.20 Slow growth 10% 10% 6 0.30 Moderate growt -5% 20% 7 0.25 High growth -25% 50% 8 9 10 11 12 13 14 15 16 17 18 19 20 21 22 Ready Sheet1 Accessibility: Good to go E .00 0
Step by Step Solution
There are 3 Steps involved in it
Step: 1

Get Instant Access to Expert-Tailored Solutions
See step-by-step solutions with expert insights and AI powered tools for academic success
Step: 2

Step: 3

Ace Your Homework with AI
Get the answers you need in no time with our AI-driven, step-by-step assistance
Get Started


