Question
As a regional sales manager for MTSU Auto, you have just finished summarizing sales data for the first half of this year (January through June),
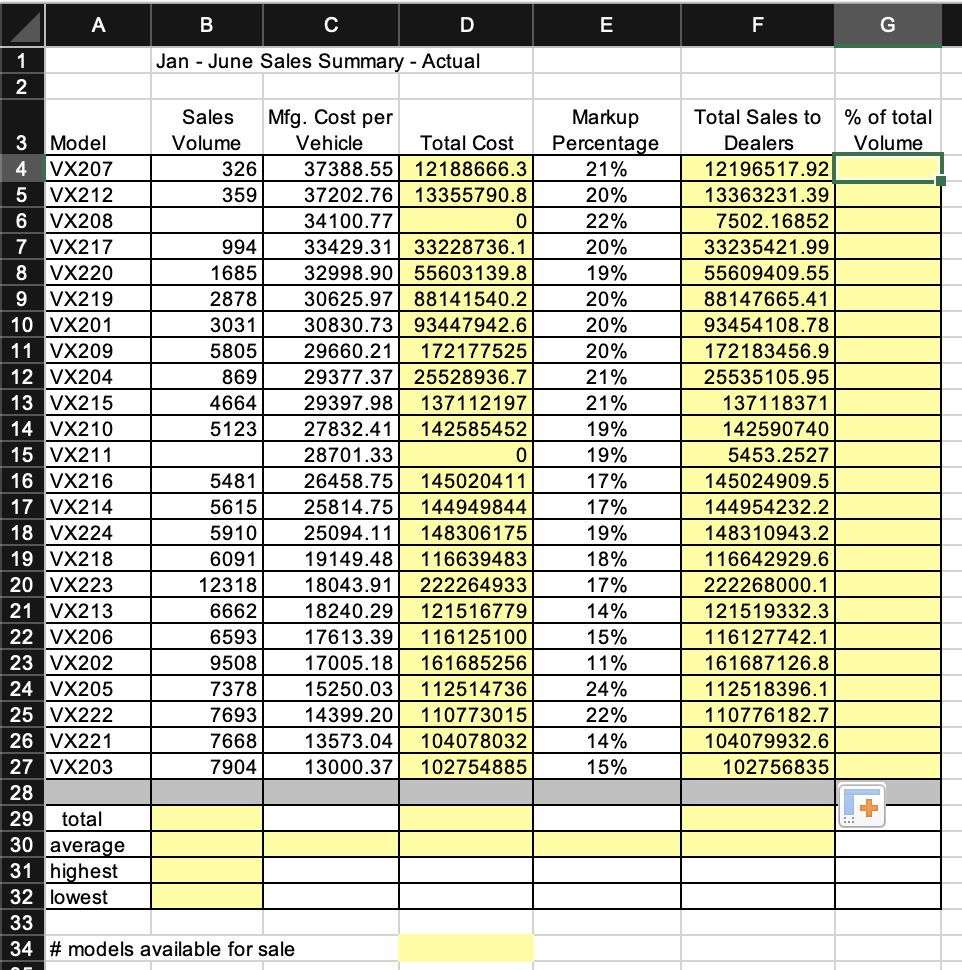
As a regional sales manager for MTSU Auto, you have just finished summarizing sales data for the first half of this year (January through June), aggregated by car model. You have started to enter data in an Excel worksheet, which lists by model the following information:
- Sales Volume, indicating the number of cars sold to dealers.
- Manufacturing (Mfg.) Cost per Vehicle.
- Total Cost of all vehicles sold for the model, which is based on the sales volume and the manufacturing costs per vehicle.
- Markup Percentage, which is the percentage charged above manufacturing cost to dealers.
- Total Sales to dealers, which is the Total Cost plus Markup. Markup equals the markup percentage times the manufacturer cost of the vehicle.
- % of Total Volume, which is based on the volume for the model compared to the volume of all models sold for the time period.
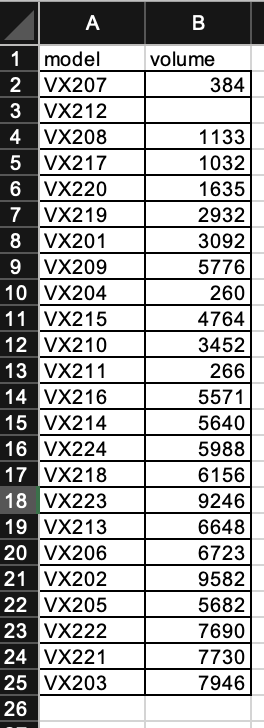
First, you need to complete the January through June computations based on the data contained in the worksheet and the information given. Then, you have been asked to create a similar worksheet to estimate sales for July through December based on volume supplied by the marketing group. These volumes are based on the historical values adjusted for seasonal demand of specific models and from market research on the popularity of models. After you have completed both the first half actual sales and the second half estimated sales, combine the data to determine expected yearly sales. Management is interested in not only the absolute value of those sales but also each model's contribution to the total yearly sales in each half of the year and in aggregate.


Step by Step Solution
There are 3 Steps involved in it
Step: 1

Get Instant Access to Expert-Tailored Solutions
See step-by-step solutions with expert insights and AI powered tools for academic success
Step: 2

Step: 3

Ace Your Homework with AI
Get the answers you need in no time with our AI-driven, step-by-step assistance
Get Started


