Answered step by step
Verified Expert Solution
Question
1 Approved Answer
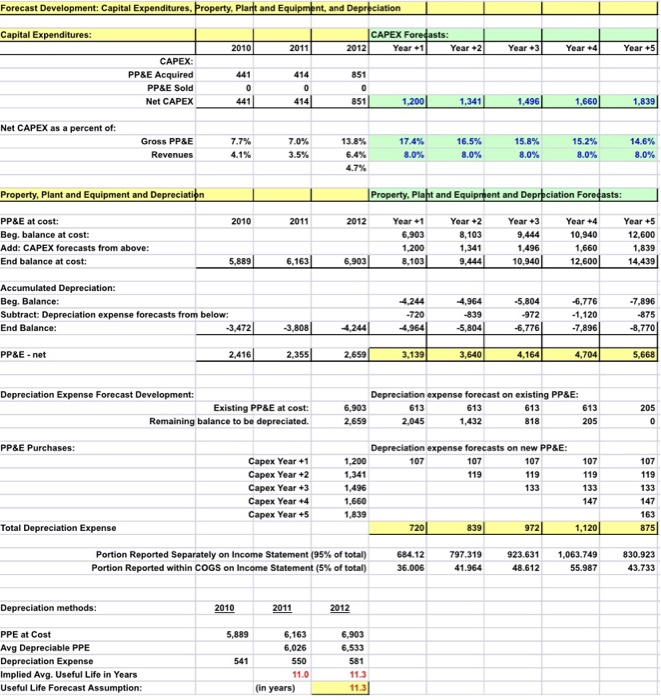
As an analyst, what can you ascertain from the capital expenditures forecasts? Is this good or bad? As an analyst, what can you ascertain from
As an analyst, what can you ascertain from the capital expenditures forecasts? Is this good or bad? As an analyst, what can you ascertain from the FF&E forecast, is this good or bad? 


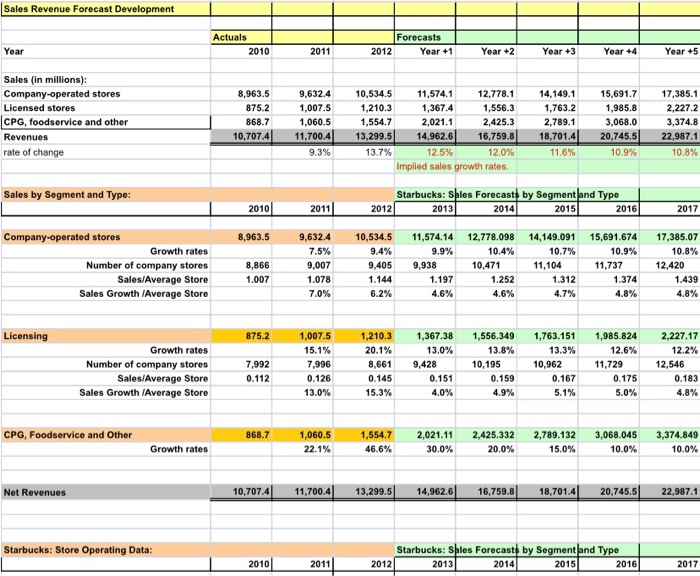
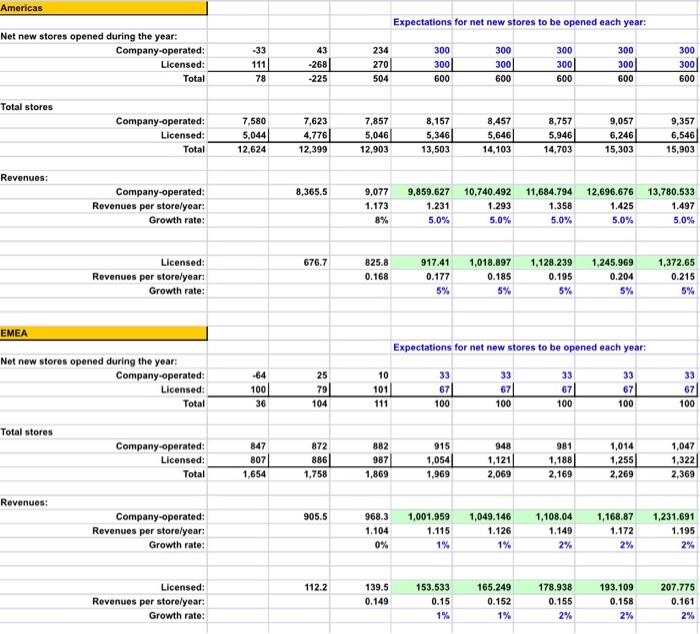
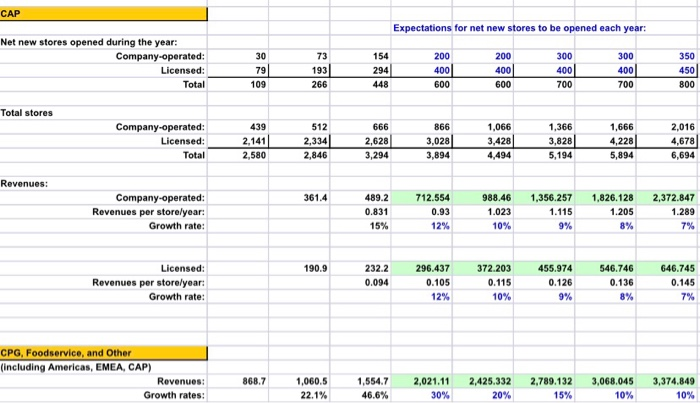
Sales Revenue Forecast Development Actuals Forecasts 2010 2011 2012 Year Year +2Year+3 Year Year +5 Sales (in millions): Company-operated stores Licensed stores CPG, foodservice and other Revenues rate of change 8,963.5 9,632.4 10,534.5 ,574. 12,778.14,149.1 15,7 17,385.1 875.21,007.5 1,210.31,367.41,556.3 7632 1,985.8 2,227.2 868.71,060.5 1,554.72,0212,425.3 2,789 3,068.0 3,374.8 10,707.4 11,700.4 13,299.5 14,962.6 16,759.8 18,701.4 20,745.522,987.1 10.8% 9.3% 13.7% 12.5% 12.0% 10.9% Implied sales growth rates. Sales by Segment and Type Starbucks: Sales Forecasts by Segmentand Type 2010 2011 2012 2013 2014 2015 2016 2017 Company-operated stores 8,963.5 9,632.410,534.5 11,574.14 12,778.098 14,149.091 15,691.674 17,385.07 10.4% 10.7% 11,104 10.9% 11,737 10.8% 12,420 Growth rates Number of company stores Sales/Average Store Sales Growth Average Store 9.4% 9,405 9,938 9.9% 8,866 1.007 9,007 1.078 10,471 1.252 4.6% 1.312 4.7% 1.374 4.8% 1.439 6.2% 875.2 1,007.5 1,210.3 1,367.38 1,556.349 1,763.151 1,985.824 2,227.17 12.2% 13.8% 10,195 15.1% 7,996 0.126 13.0% 20.1% 8,661 0.145 15.3% 13.0% 9,428 Growth rates Number of company stores Sales/Average Store Sales Growth/Average Store 12.6% 7,992 10,962 11,729 12,546 0.175 5.0% 0.167 4.0% 4.9% 4.8% CPG, Foodservice and Other 868.7 1060.51,554.7 2,021.11 2,425.332 2,789.132 3,068.045 10.0% 3,374.849 10.0% Growth rates 22.1% 46.6% 30.0% 20.0% 15.0% Net Revenues 10,707.4 11,700.4 13,299.5 14, 962.61 16,759.8 18,701.4 745.5 22,987.1 Starbucks: Store Operating Data Starbucks: Sales Forecasts by Segment and Type 2010 2013 2016 Expectations for net new stores to be opened each year Net new stores opened during the year: 234 270 268 300 300 300 300 300 Total 78 Total stores 7,580 5,044 12,624 7,623 4,776 12,399 7,857 5,046 12,903 5,346 13,503 5,646 14,103 8,757 5,946 14,703 9,057 6,246 15,303 9,357 6,546 15,903 Total 8,365.5 Revenues per storelyear Growth rate: 9,077 9,859.627 10,740.492 11,684.794 12,696.676 13,780.533 1.497 5.0% 1.358 5.0% 1.173 1.231 1.293 1.425 5.0% 5.0% 825.8 0.168 Licensed: 676.7 17.4 1,018.897 1,128.239 1,245.969 1,372.65 0.195 Revenues per storelyear Growth rate: 0.185 0.204 0.215 EMEA Expectations for net new stores to be opened each year t new stores opened during the year Co 101 Total 36 104 100 100 100 100 100 Total stores 872 1,014 1,255 2,269 1,047 1,322 2,369 Company-operated: 847 987 1,869 1,054 1,969 1,188 2,169 1,654 1,758 2,069 Company-operated: Revenues per storelyear Growth rate: 905.5 968.3 1,001.959 1,049.146 1,108.04 ,168.87 1,231.691 1.104 1.115 1.126 1.149 1.172 1.195 193.109 0.158 112.2 139.5 0.149 153.533 0.15 165.249 0.152 178.938 0.155 207.775 0.161 Revenues per storelyear Growth rate: CAP Expectations for net new stores to be opened each year: Net new stores opened during the year 30 79 109 73 193 154 294 300 400 350 450 Licensed 400 400 Total Total stores 2,141 2,580 512 2,334 2,846 2,628 3,294 3,028 3,894 1,066 3,428 4,494 1,366 3,828 5,194 1,666 4,228 5,894 2,016 4,678 6,694 Total Company-operated: Revenues per storelyear Growth rate: 489.2 0.831 15% 712.554 0.93 12% 361.4 988.46 1,356.257 1,826.128 2,372.847 1.289 1.023 10% 1.115 1.205 190.9 232.2 0.094 455.974 0.126 546.746 0.136 646.745 0.145 96.437372.203 4 Revenues per storelyear Growth rate 0.105 12% 0.115 10% CPG, Foodservice, and Other (including Americas,EMEA, CAP) 868.7 1,060.5 22.1% ,554.72,021.11 2,425.3322,789.132 3,068.045 3,374.849 46.6% Growth rates: 30% 15% 10% 10% 


Step by Step Solution
There are 3 Steps involved in it
Step: 1

Get Instant Access to Expert-Tailored Solutions
See step-by-step solutions with expert insights and AI powered tools for academic success
Step: 2

Step: 3

Ace Your Homework with AI
Get the answers you need in no time with our AI-driven, step-by-step assistance
Get Started


