Answered step by step
Verified Expert Solution
Question
1 Approved Answer
As an investment analyst, present your recommendation to include one of these companies in an international investment portfolio. Your recommendation should be based strictly on


As an investment analyst, present your recommendation to include one of these companies in an international investment portfolio. Your recommendation should be based strictly on the company's cash position and its comparison chart. PLEASE HELP!
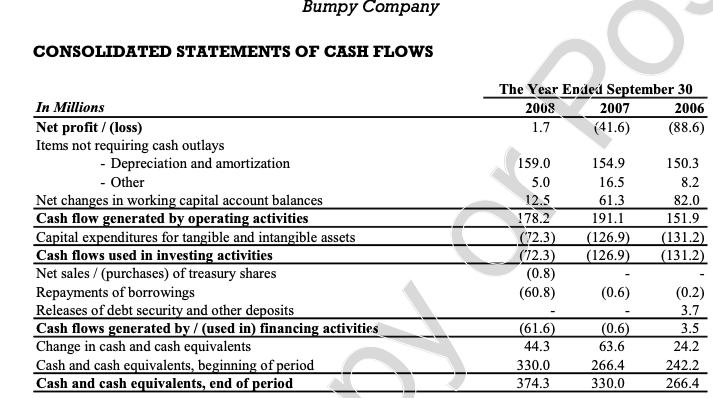
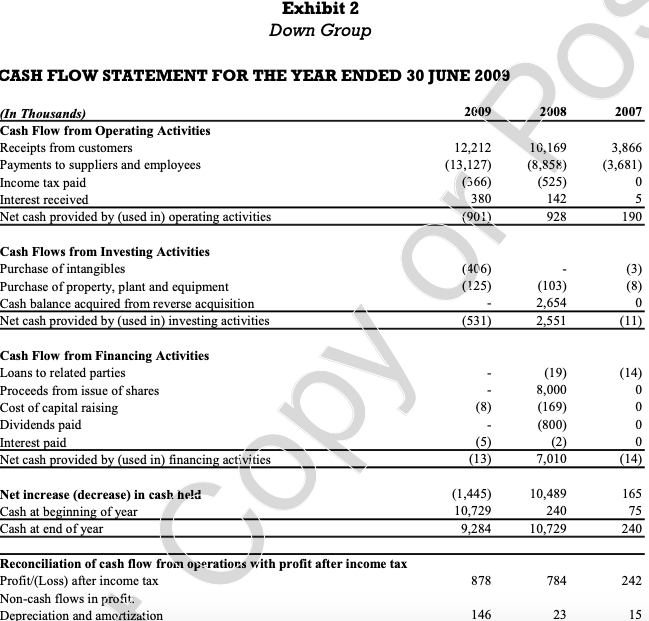
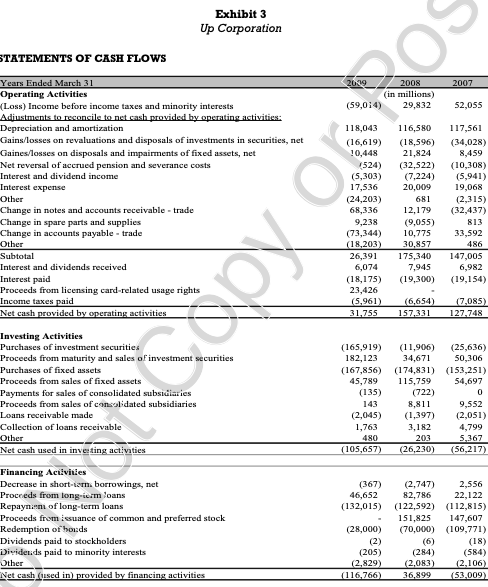
Bumpy Company CONSOLIDATED STATEMENTS OF CASH FLOWS The Year Ended September 30 2008 2007 2006 1.7 (41.6) (88.6) In Millions Net profit / (loss) Items not requiring cash outlays - Depreciation and amortization - Other Net changes in working capital account balances Cash flow generated by operating activities Capital expenditures for tangible and intangible assets Cash flows used in investing activities Net sales / purchases) of treasury shares Repayments of borrowings Releases of debt security and other deposits Cash flows generated by / (used in) financing activities Change in cash and cash equivalents Cash and cash equivalents, beginning of period Cash and cash equivalents, end of period 159.0 5.0 12.5 178.2 .(22.3) (72.3) (0.8) (60.8) 154.9 16.5 61.3 191.1 (126.9) (126.9) 150.3 8.2 82.0 151.9 (131.2) (131.2) (0.6) (61.6) 44.3 330.0 374.3 (0.6) 63.6 266.4 330.0 (0.2) 3.7 3.5 24.2 242.2 266.4 Exhibit 2 Down Group CASH FLOW STATEMENT FOR THE YEAR ENDED 30 JUNE 2009 2009 2008 2007 (In Thousands) Cash Flow from Operating Activities Receipts from customers Payments to suppliers and employees Income tax paid Interest received Net cash provided by (used in) operating activities 12,212 (13,127) (566) 380 (90) 10,169 (8,858) (525) 142 928 3,866 (3,681) 0 5 190 (406) (125) (103) 2,654 2,551 (3) (8) 0 (11) (531) Cash Flows from Investing Activities Purchase of intangibles Purchase of property, plant and equipment Cash balance acquired from reverse acquisition Net cash provided by (used in) investing activities Cash Flow from Financing Activities Loans to related parties Proceeds from issue of shares Cost of capital raising Dividends paid Interest paid Net cash provided by (used in) financing activities (8) (19) 8,000 (169) (800) (2) 7,010 (14) 0 0 0 0 (14) (5) (13) Net increase (decrease) in cash held Cash at beginning of year Cash at end of year (1,445) 10,729 9,284 10,489 240 10,729 165 75 240 878 784 242 Reconciliation of cash flow from operatiocs with profit after income tax Profit/(Loss) after income tax Non-cash flows in profit. Depreciation and amortization 146 23 15 Exhibit 3 Up Corporation STATEMENTS OF CASH FLOWS 2007 2019 2008 (in millions) (59,014) 29,832 52,055 Years Ended March 31 Operating Activities (Loss) Income before income taxes and minority interests Adjustments to reconcile to net cash provided by operating activities: Depreciation and amortization Gains/losses on revaluations and disposals of investments in securities, net Gaines/losses on disposals and impairments of fixed assets, net Net reversal of accrued pension and severance costs Interest and dividend income Interest expense Other Change in notes and accounts receivable-trade Change in spare parts and supplies Change in accounts payable - trade Other Subtotal Interest and dividends received Interest paid Proceeds from licensing card-related usage rights Income taxes paid Net cash provided by operating activities 118,043 (16,619) 10,448 1324) (5,303) 17,536 (24,203) 68,336 9,238 (73,344) (18,203) 26,391 6,074 (18,175) 23,426 (5,961) 31.755 116,580 (18,596) 21,824 (32,522) (7,224) 20,009 681 12,179 (9,055) 10,775 30,857 175,340 7,945 (19,300) 117,561 (34,028) 8,459 (10,308) (5,941) 19,068 (2,315) (32,437) 813 33,592 486 147,005 6,982 (19,154) (6,654) 157,331 (7,085) 127.748 Investing Activities Purchases of investment securities Proceeds from maturity and sales of investment securities Purchases of fixed assets Proceeds from sales of fixed assets Payments for sales of consolidated subsidiaries Proceeds from sales of consolidated subsidiaries Loans receivable made Collection of loans receivable Other Net cash used in inverting activities (165,919) (11,906) (25,636) 182,123 34,671 50,306 (167,856) (174,831) (153,251) 45,789 115,759 54,697 (135) (722) 0 143 8,811 9,552 (2,045) (1,397) (2,051) 1,763 3,182 4,799 480 203 5,367 (105,657) (26,230) (56,217) Financing Activities Decrease in short-term borrowings, net Proceeds from longiorm loans Repaynin of long-term loans Proceeds from issuance of common and preferred stock Redemption of bonds Dividends paid to stockholders Dividends paid to minority interests Other Net cash (used in provided by financing activities (367) (2,747) 2,556 46,652 82,786 22,122 (132,015) (122,592) (112,815) 151,825 147,607 (28,000) (70,000) (109,771) (2) (6) (18) (205) (284) (584) (2,829) (2.083) (2,106) (116.766 36,899 (53,009) Bumpy Company CONSOLIDATED STATEMENTS OF CASH FLOWS The Year Ended September 30 2008 2007 2006 1.7 (41.6) (88.6) In Millions Net profit / (loss) Items not requiring cash outlays - Depreciation and amortization - Other Net changes in working capital account balances Cash flow generated by operating activities Capital expenditures for tangible and intangible assets Cash flows used in investing activities Net sales / purchases) of treasury shares Repayments of borrowings Releases of debt security and other deposits Cash flows generated by / (used in) financing activities Change in cash and cash equivalents Cash and cash equivalents, beginning of period Cash and cash equivalents, end of period 159.0 5.0 12.5 178.2 .(22.3) (72.3) (0.8) (60.8) 154.9 16.5 61.3 191.1 (126.9) (126.9) 150.3 8.2 82.0 151.9 (131.2) (131.2) (0.6) (61.6) 44.3 330.0 374.3 (0.6) 63.6 266.4 330.0 (0.2) 3.7 3.5 24.2 242.2 266.4 Exhibit 2 Down Group CASH FLOW STATEMENT FOR THE YEAR ENDED 30 JUNE 2009 2009 2008 2007 (In Thousands) Cash Flow from Operating Activities Receipts from customers Payments to suppliers and employees Income tax paid Interest received Net cash provided by (used in) operating activities 12,212 (13,127) (566) 380 (90) 10,169 (8,858) (525) 142 928 3,866 (3,681) 0 5 190 (406) (125) (103) 2,654 2,551 (3) (8) 0 (11) (531) Cash Flows from Investing Activities Purchase of intangibles Purchase of property, plant and equipment Cash balance acquired from reverse acquisition Net cash provided by (used in) investing activities Cash Flow from Financing Activities Loans to related parties Proceeds from issue of shares Cost of capital raising Dividends paid Interest paid Net cash provided by (used in) financing activities (8) (19) 8,000 (169) (800) (2) 7,010 (14) 0 0 0 0 (14) (5) (13) Net increase (decrease) in cash held Cash at beginning of year Cash at end of year (1,445) 10,729 9,284 10,489 240 10,729 165 75 240 878 784 242 Reconciliation of cash flow from operatiocs with profit after income tax Profit/(Loss) after income tax Non-cash flows in profit. Depreciation and amortization 146 23 15 Exhibit 3 Up Corporation STATEMENTS OF CASH FLOWS 2007 2019 2008 (in millions) (59,014) 29,832 52,055 Years Ended March 31 Operating Activities (Loss) Income before income taxes and minority interests Adjustments to reconcile to net cash provided by operating activities: Depreciation and amortization Gains/losses on revaluations and disposals of investments in securities, net Gaines/losses on disposals and impairments of fixed assets, net Net reversal of accrued pension and severance costs Interest and dividend income Interest expense Other Change in notes and accounts receivable-trade Change in spare parts and supplies Change in accounts payable - trade Other Subtotal Interest and dividends received Interest paid Proceeds from licensing card-related usage rights Income taxes paid Net cash provided by operating activities 118,043 (16,619) 10,448 1324) (5,303) 17,536 (24,203) 68,336 9,238 (73,344) (18,203) 26,391 6,074 (18,175) 23,426 (5,961) 31.755 116,580 (18,596) 21,824 (32,522) (7,224) 20,009 681 12,179 (9,055) 10,775 30,857 175,340 7,945 (19,300) 117,561 (34,028) 8,459 (10,308) (5,941) 19,068 (2,315) (32,437) 813 33,592 486 147,005 6,982 (19,154) (6,654) 157,331 (7,085) 127.748 Investing Activities Purchases of investment securities Proceeds from maturity and sales of investment securities Purchases of fixed assets Proceeds from sales of fixed assets Payments for sales of consolidated subsidiaries Proceeds from sales of consolidated subsidiaries Loans receivable made Collection of loans receivable Other Net cash used in inverting activities (165,919) (11,906) (25,636) 182,123 34,671 50,306 (167,856) (174,831) (153,251) 45,789 115,759 54,697 (135) (722) 0 143 8,811 9,552 (2,045) (1,397) (2,051) 1,763 3,182 4,799 480 203 5,367 (105,657) (26,230) (56,217) Financing Activities Decrease in short-term borrowings, net Proceeds from longiorm loans Repaynin of long-term loans Proceeds from issuance of common and preferred stock Redemption of bonds Dividends paid to stockholders Dividends paid to minority interests Other Net cash (used in provided by financing activities (367) (2,747) 2,556 46,652 82,786 22,122 (132,015) (122,592) (112,815) 151,825 147,607 (28,000) (70,000) (109,771) (2) (6) (18) (205) (284) (584) (2,829) (2.083) (2,106) (116.766 36,899 (53,009)Step by Step Solution
There are 3 Steps involved in it
Step: 1

Get Instant Access to Expert-Tailored Solutions
See step-by-step solutions with expert insights and AI powered tools for academic success
Step: 2

Step: 3

Ace Your Homework with AI
Get the answers you need in no time with our AI-driven, step-by-step assistance
Get Started


