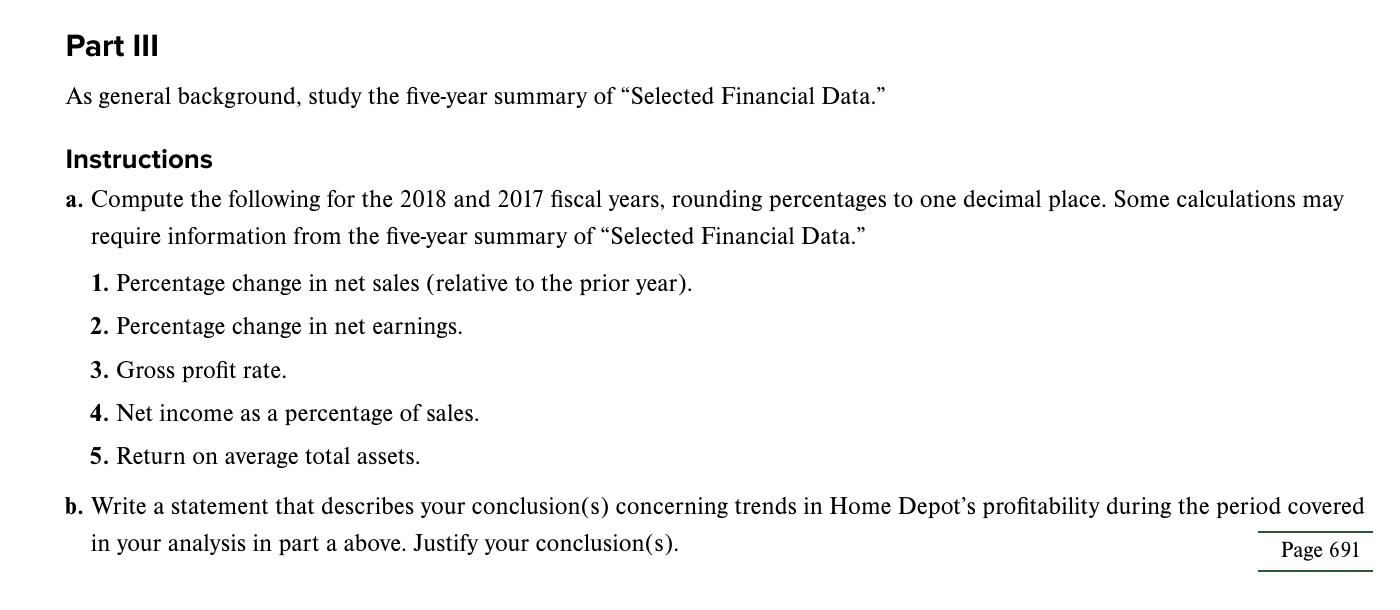
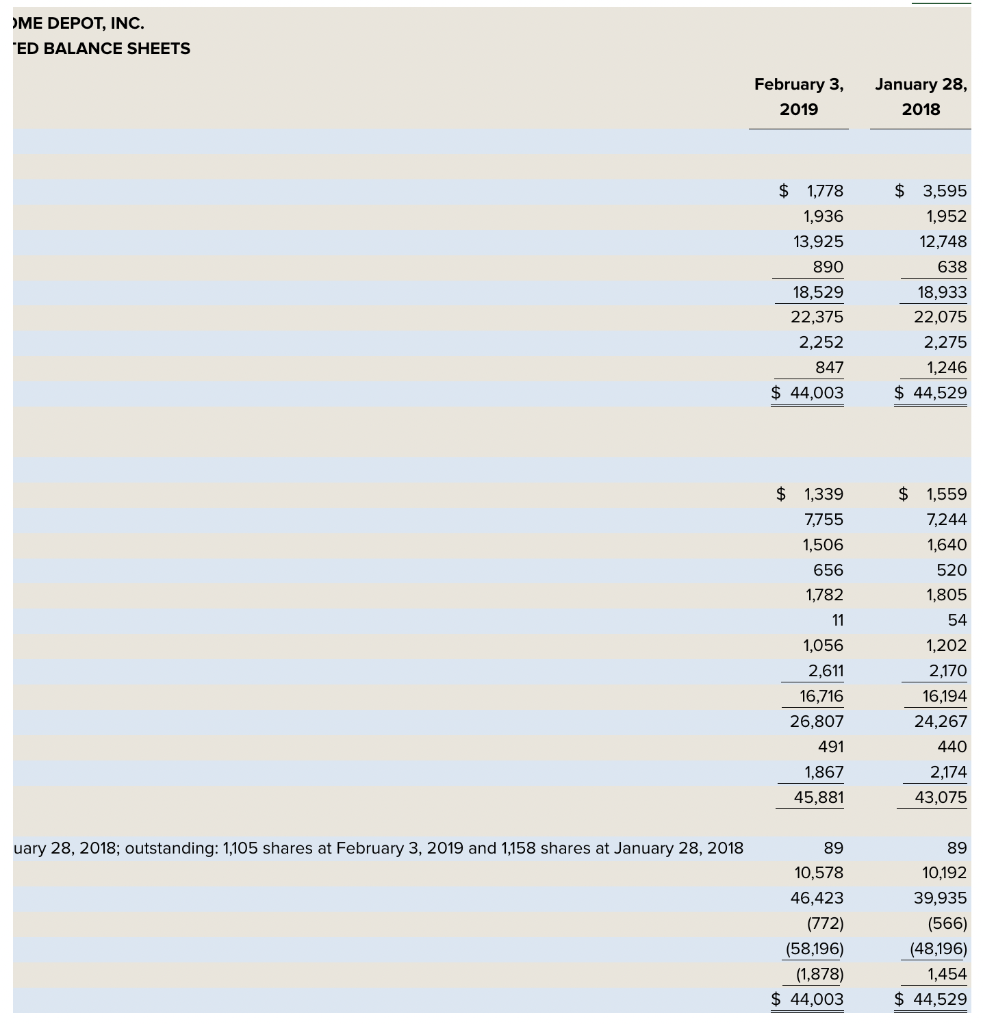
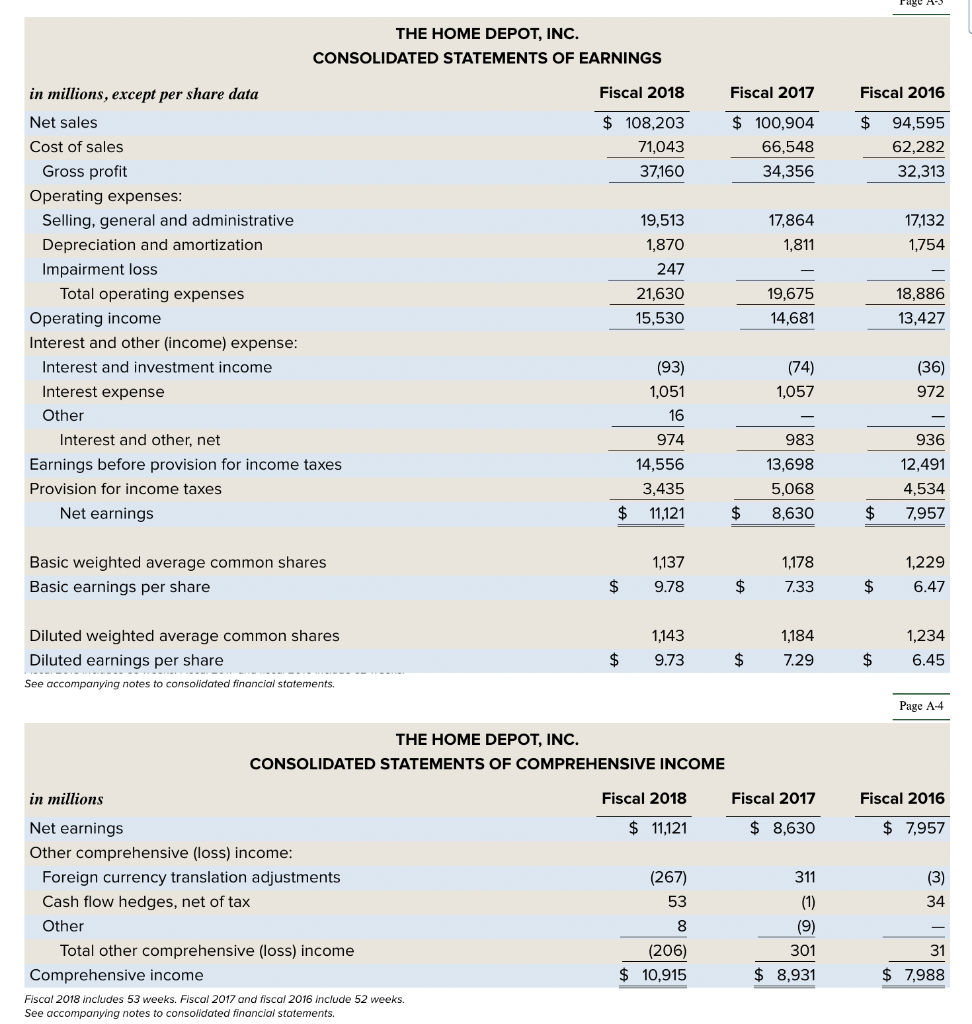
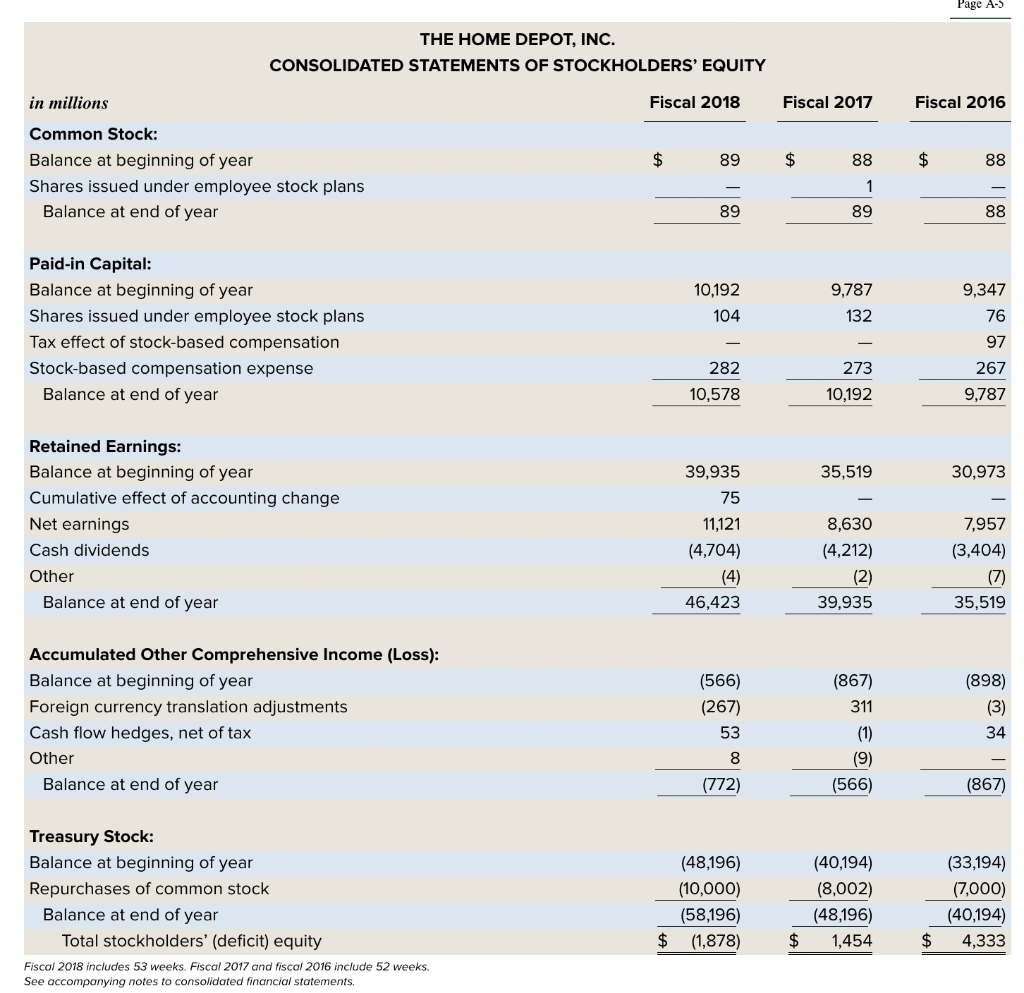
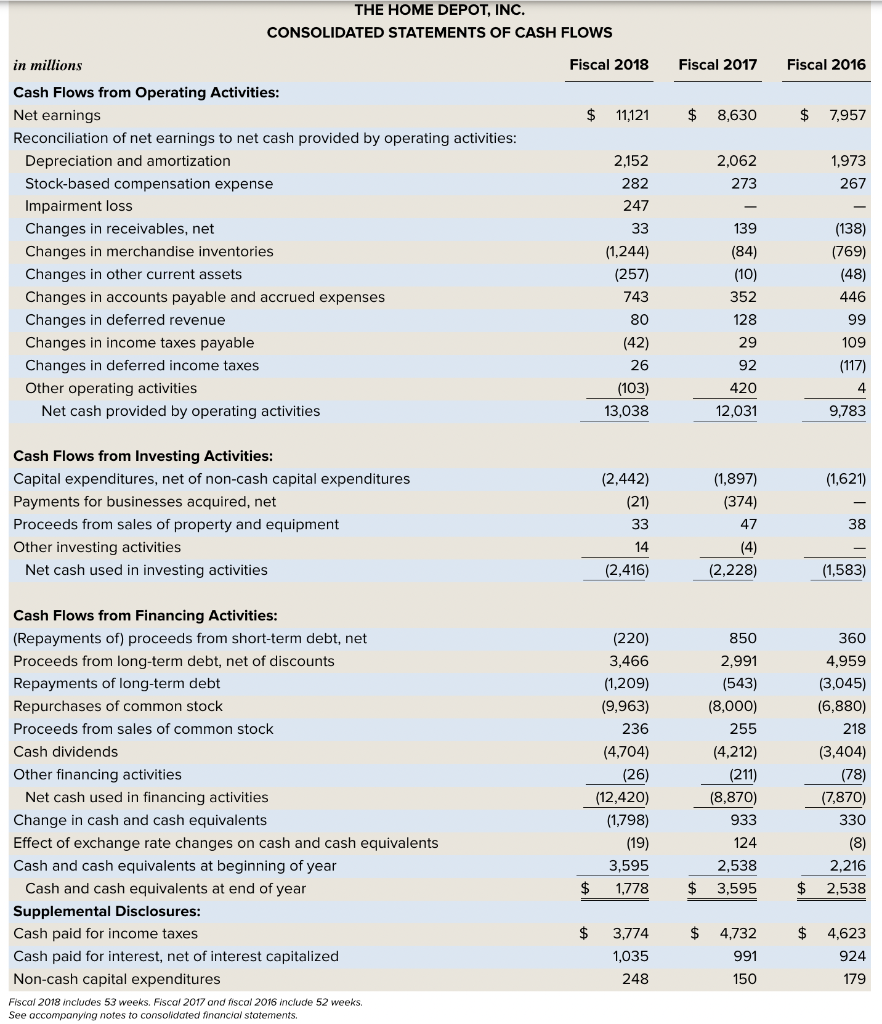
As general background, study the five-year summary of "Selected Financial Data." Instructions a. Compute the following for the 2018 and 2017 fiscal years, rounding percentages to one decimal place. Some calculations may require information from the five-year summary of "Selected Financial Data." 1. Percentage change in net sales (relative to the prior year). 2. Percentage change in net earnings. 3. Gross profit rate. 4. Net income as a percentage of sales. 5. Return on average total assets. b. Write a statement that describes your conclusion(s) concerning trends in Home Depot's profitability during the period covered in your analysis in part a above. Justify your conclusion(s). Page 691 JME DEPOT, INC. 'ED BALANCE SHEETS THE HOME DEPOT, INC. CONSOLIDATED STATEMENTS OF EARNINGS in millions, except per share data Net sales Cost of sales Gross profit Operating expenses: Selling, general and administrative Depreciation and amortization Impairment loss Total operating expenses Operating income Interest and other (income) expense: Interest and investment income Interest expense Other Interest and other, net Earnings before provision for income taxes Provision for income taxes Net earnings Basic weighted average common shares Basic earnings per share \begin{tabular}{rrr} 19,513 & 17,864 & 17,132 \\ 1,870 & 1,811 & 1,754 \\ 247 & & \\ \cline { 2 - 2 }r & 19,675 & 18,886 \\ \hline 15,530 & 14,681 & 13,427 \\ \hline \end{tabular} Diluted weighted average common shares Diluted earnings per share See accompanying notes to consolidated financial statements. Page A-4 THE HOME DEPOT, INC. CONSOLIDATED STATEMENTS OF COMPREHENSIVE INCOME in millions Net earnings $11,121Fiscal2018$8,630Fiscal2017$7,957Fiscal2016 Other comprehensive (loss) income: Foreign currency translation adjustments Cash flow hedges, net of tax Other Total other comprehensive (loss) income Comprehensive income Fiscal 2018 includes 53 weeks. Fiscal 2017 and fiscal 2016 include 52 weeks. See accompanying notes to consolidated financial statements. THE HOME DEPOT, INC. CONSOLIDATED STATEMENTS OF STOCKHOLDERS' EQUITY in millions Paid-in Capital: Balance at beginning of year Shares issued under employee stock plans Tax effect of stock-based compensation Stock-based compensation expense Balance at end of year Retained Earnings: Balance at beginning of year Cumulative effect of accounting change Net earnings Cash dividends \begin{tabular}{rrr} 10,192 & 9,787 & 9,347 \\ 104 & 132 & 76 \\ & & 97 \\ 282 & 273 & 267 \\ \hline 10,578 & 10,192 & 9,787 \\ \hline \end{tabular} Other Balance at end of year Accumulated Other Comprehensive Income (Loss): Balance at beginning of year Foreign currency translation adjustments Cash flow hedges, net of tax Other Balance at end of year Treasury Stock: Balance at beginning of year Repurchases of common stock Balance at end of year Total stockholders' (deficit) equity Fiscal 2018 includes 53 weeks. Fiscal 2017 and fiscal 2016 include 52 weeks. See accompanying notes to consolidated financial statements. THE HOME DEPOT, INC. CONSOLIDATED STATEMENTS OF CASH FLOWS in millions Cash Flows from Operating Activities: Net earnings Reconciliation of net earnings to net cash provided by operating activities: Depreciation and amortization Stock-based compensation expense Impairment loss Changes in receivables, net Changes in merchandise inventories Changes in other current assets Changes in accounts payable and accrued expenses Changes in deferred revenue Changes in income taxes payable Changes in deferred income taxes Other operating activities Net cash provided by operating activities Cash Flows from Investing Activities: Capital expenditures, net of non-cash capital expenditures Payments for businesses acquired, net Proceeds from sales of property and equipment Other investing activities Net cash used in investing activities Cash Flows from Financing Activities: (Repayments of) proceeds from short-term debt, net Proceeds from long-term debt, net of discounts Repayments of long-term debt Repurchases of common stock Proceeds from sales of common stock Cash dividends Other financing activities Net cash used in financing activities Change in cash and cash equivalents Effect of exchange rate changes on cash and cash equivalents 2,1522822,0622731,973267 Cash and cash equivalents at beginning of year Cash and cash equivalents at end of year Supplemental Disclosures: Cash paid for income taxes Cash paid for interest, net of interest capitalized Non-cash capital expenditures Fiscal 2018 includes 53 weeks. Fiscal 2017 and fiscol 2016 include 52 weeks. See occompanying notes to consolidated financiol stotements


