Question
As indicated by the chart below, the YoY assessment of ROE and ROA highlights the economic effects of the COVID-19 epidemic as inflation continues to
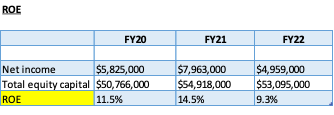
As indicated by the chart below, the YoY assessment of ROE and ROA highlights the economic effects of the COVID-19 epidemic as inflation continues to jeopardize and halt the current state of the economy.

ROE at FY20 implies a return to shareholders of 11.5%, which is satisfactory but should be further analyzed to provide context regarding historical performance and industry peer comparisons. ROE increased to 14.5% (a 3% increase) in FY21, demonstrating the company's efficiency in generating profits and better utilization of equity. Due to lower profitability (net income decreased by 37% in FY22), the decline to 9.3% in FY22 was a 5.2% decrease from the prior assessed periods. The historical decline could be interpreted as a sign of the effects of the pandemic inflicted in the economy. Understanding themeasures,the bank can take in order to increase its ROE can be obtained by doing additional analysisinto the organization's operations, industry, and economic trends.

The ROA of 0.86% in FY20 was relatively low, indicating that the organization encountered challenges in earning significant profits as a result of the COVID-19 shutdowns, which were responsible for the low performance. The bank's ROA increased to 1.39% in FY21, increasing 62% from the previous year. The increase suggested profitability as the pandemic was mitigated by the rollout of the vaccine as well governmental assistant enabling the economy in resuming operations after a brief halt, as reflected in the net income figure for this period of $7.9 billion (vs $5.8 billion and $4.9 billion in FY20 and FY22, respectively). With inflation rates reaching an all-time high in FY22, the company's revenues fell substantially, highlighting fundamental economic and industry reasons that contributed to this decrease.
Question:
Based on the reported balance sheet and income statement, calculate your institutions net profit margin, asset utilization ratio and equity multiplier for 12/31/22, 12/31/21 and 12/31/20. Are these ratios better or worse for the most recent period as compared to the previous two time periods?

where


For total operating revenue use the sum of total interest income and total non-interest income. Which of these ratios is primarily responsible for the changes in the ROE and ROA?
\begin{tabular}{|l|l|l|l|} \hline & \multicolumn{1}{|c|}{FY20} & \multicolumn{1}{c|}{FY21} & \multicolumn{1}{c|}{ FY22 } \\ \hline Net income & & & \\ \hline & $5,825,000 & $7,963,000 & $4,959,000 \\ \hline ROE & & & \\ \hline \end{tabular} \begin{tabular}{|l|c|c|c|} & FY20 & FY21 & FY22 \\ \hline & & & \\ \hline Total Assets & $674,805,000 & $573,284,000 & $553,905,000 \\ \hline ROA & & & \\ \hline \end{tabular} ROE=N Thenet=TotaloperatingrevenuesNetincome(6-15)ThedegreeofTotaloperatingrevenues(6-16)Theequitymultiplier(EM)=TotalequitycapitalTotalassetsStep by Step Solution
There are 3 Steps involved in it
Step: 1

Get Instant Access to Expert-Tailored Solutions
See step-by-step solutions with expert insights and AI powered tools for academic success
Step: 2

Step: 3

Ace Your Homework with AI
Get the answers you need in no time with our AI-driven, step-by-step assistance
Get Started


