Question
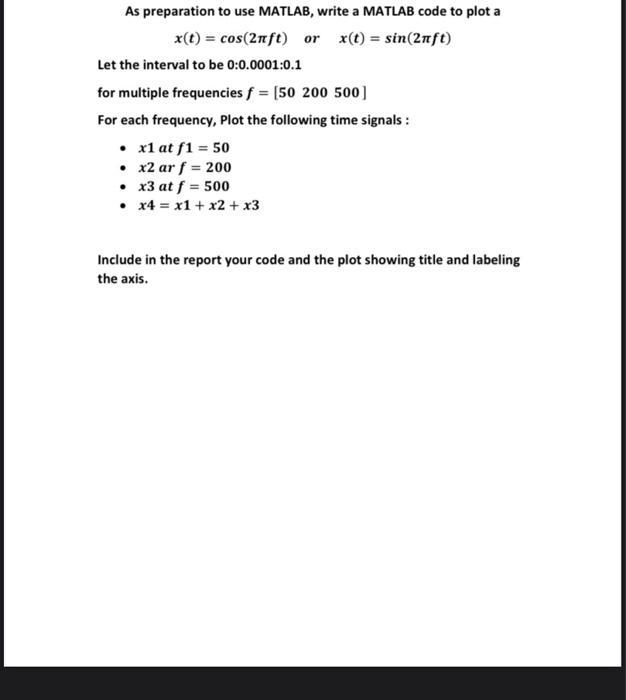
As preparation to use MATLAB, write a MATLAB code to plot a x(t) = cos(2nft) or x(t) = sin(2nft) Let the interval to be

As preparation to use MATLAB, write a MATLAB code to plot a x(t) = cos(2nft) or x(t) = sin(2nft) Let the interval to be 0:0.0001:0.1 for multiple frequencies f = [50 200 500] For each frequency, Plot the following time signals: x1 at f1 = 50 x2 ar f = 200 x3 at f= 500 x4 = x1 + x2 + x3 Include in the report your code and the plot showing title and labeling the axis.
Step by Step Solution
3.41 Rating (151 Votes )
There are 3 Steps involved in it
Step: 1
The required MATLAB code is for the function xt cos 27ft at the giv frequencies 50 200 500 and also ...
Get Instant Access to Expert-Tailored Solutions
See step-by-step solutions with expert insights and AI powered tools for academic success
Step: 2

Step: 3

Ace Your Homework with AI
Get the answers you need in no time with our AI-driven, step-by-step assistance
Get StartedRecommended Textbook for
Signals and Systems using MATLAB
Authors: Luis Chaparro
2nd edition
123948126, 978-0123948120
Students also viewed these Accounting questions
Question
Answered: 1 week ago
Question
Answered: 1 week ago
Question
Answered: 1 week ago
Question
Answered: 1 week ago
Question
Answered: 1 week ago
Question
Answered: 1 week ago
Question
Answered: 1 week ago
Question
Answered: 1 week ago
Question
Answered: 1 week ago
Question
Answered: 1 week ago
Question
Answered: 1 week ago
Question
Answered: 1 week ago
Question
Answered: 1 week ago
Question
Answered: 1 week ago
Question
Answered: 1 week ago
Question
Answered: 1 week ago
Question
Answered: 1 week ago
Question
Answered: 1 week ago
Question
Answered: 1 week ago
Question
Answered: 1 week ago
Question
Answered: 1 week ago
Question
Answered: 1 week ago
View Answer in SolutionInn App


