As product marketing manager, one of our jobs is to prepare recommendations to the Executive Committee as to how advertising expenditures should be allocated. Last years advertising budget of $40,000 was spent in equal increments over the four quarters. Initial expectations are that we will repeat this plan in the coming year. However, the Committee would like to know if some other allocation would be advantageous, and whether the total budget should be changed.
Our product sells for $40 and costs us $25 to produce. Sales in the past have been seasonal, and our consultants have estimated seasonal adjustment factors for unit sales as follows:
Q1 90%
Q2 110%
Q3 80%
Q4 120%
(A seasonal adjustment factor measures the percent of average quarterly demand experienced in a given quarter.)
In addition to production costs, we must take into account the cost of the sales force (projected to be $34,000 over the year, allocated as follows: Q1 and Q2, $8000 each; Q3 and Q4, $9000 each), the cost of advertising itself, and overhead (typically around 15% of revenues).
Quarterly unit sales seem to run around 4000 units when advertising is around $10,000. Clearly, advertising will increase sales, but there are limits to its impact. Our consultants several years ago estimated the relationship between advertising and sales. Converting that relationship to current conditions gives the following formula:
Unit sales = 35*Seasonal factor*SQRT(3000 + Advertising),
where SQRT( ) stands for the square-root function, e.g., SQRT(4)=2, and it is a built-in function in Excel.
1)If the firm's advertising budget is $32,000 (instead of $40,000) and the firm allocates it optimally over the four quarters, the firm's break-even production cost is:
a)27.14
b)28.56
c)27.13
d)29.56
2)If the firm's advertising budget is $32,000 (instead of $40,000) and the firm allocates it optimally over the four quarters, the firm's profit is:
a.67,791.59
b.66,149.51
c.68,303.21
d.69,000.13
3)If the firm's advertising budget is $32,000 (instead of $40,000) the firm spends it in equal increments over the four quarters, the firm's profit is:
a.67,897.45
b.66,149.91
c.66,500.34
d.68,765.54
4)In the Advertising Budget Decision Case, the unit sales formula is: Unit sales = 35*seasonal_factor*SQRT(3000+advertising). A $1 increase in advertising causes the unit sales to increase more when seasonal_factor is 0.9 instead of 1.1.
a.True
b.False
5)Excel is a software that allows us to perform algebraic calculations.
a.True
b.False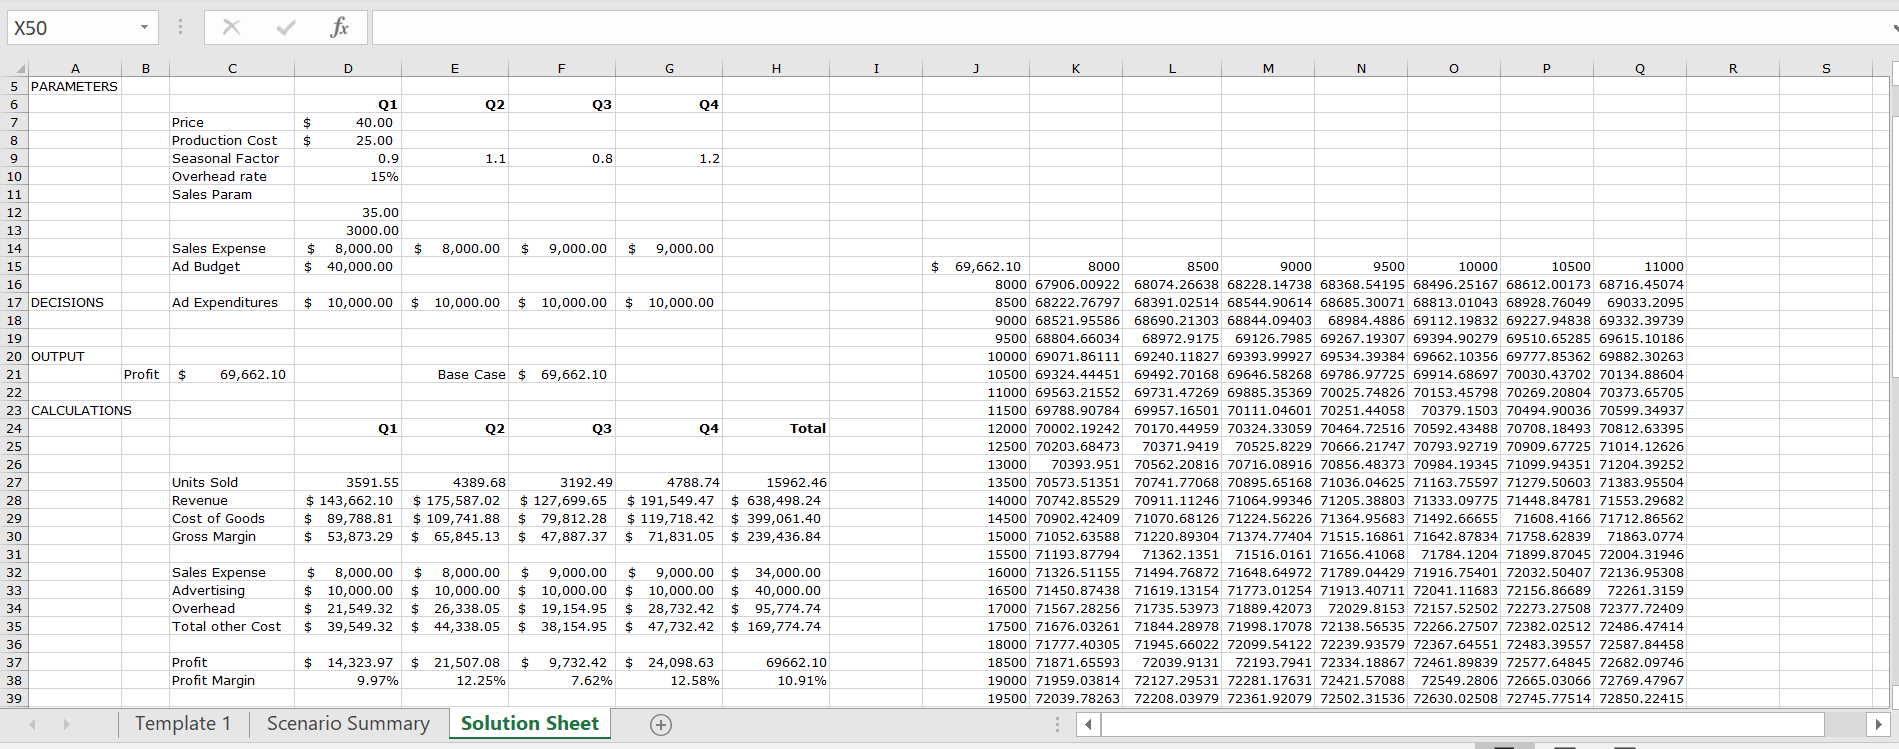
X50 - X fx I J K M. N O P Q 5 PARAMETERS Q2 Q3 Q4 $ $ Price Production Cost Seasonal Factor Overhead rate Sales Param 01 40.00 25.00 0.9 15% 1.1 0.8 1.2 13 14 15 35.00 3000.00 8,000.00 40,000.00 $ 8,000.00 $ 9,000.00 $ 9,000.00 Sales Expense Ad Budget $ $ $ 16 17 DECISIONS Ad Expenditures $ 10,000.00 $ 10,000.00 $ 10,000.00 $ 10,000.00 18 19 20 OUTPUT 21 Profit $ 69,662.10 Base Case $ 69,662.10 22 23 CALCULATIONS Q2 Q3 Total Units Sold Revenue Cost of Goods Gross Margin 3591.55 $ 143,662.10 $ 89,788.81 $ 53,873.29 4389.68 $ 175,587.02 $ 109,741.88 $ 65,845.13 3192.49 $ 127,699.65 $ 79,812.28 $ 47,887.37 4788.74 $ 191,549.47 $ 119,718.42 $ 71,831.05 15962.46 $ 638,498.24 $ 399,061.40 $ 239,436.84 69,662.10 8000 8500 9000 9500 10000 10500 11000 8000 67906.00922 68074.26638 68228.14738 68368.54195 68496.25167 68612.00173 68716.45074 8500 68222.76797 68391.02514 68544.90614 68685.30071 68813.01043 68928.76049 69033.2095 9000 68521.95586 68690.21303 68844.09403 68984.4886 69112.19832 69227.94838 69332.39739 9500 68804.66034 68972.9175 69126.7985 69267.19307 69394.90279 69510.65285 69615.10186 10000 69071.86111 69240.11827 69393.99927 69534.39384 69662.10356 69777.85362 69882.30263 10500 69324.44451 69492.70168 69646.58268 69786.97725 69914.68697 70030.43702 70134.88604 11000 69563.21552 69731.47269 69885.35369 70025.74826 70153.45798 70269.20804 70373.65705 11500 69788.90784 69957.16501 70111.04601 70251.44058 70379.1503 70494.90036 70599.34937 12000 70002.19242 70170.44959 70324.33059 70464.72516 70592.43488 70708.18493 70812.63395 12500 70203.68473 70371.9419 70525.8229 70666.21747 70793.92719 70909.67725 71014.12626 13000 70393.951 70562.20816 70716.08916 70856.48373 70984.19345 71099.94351 71204.39252 13500 70573.51351 70741.77068 70895.65168 71036.04625 71163.75597 71279.50603 71383.95504 14000 70742.85529 70911.11246 71064.99346 71205.38803 71333.09775 71448.84781 71553.29682 14500 70902.42409 71070.68126 71224.56226 71364.95683 71492.6665571608.4166 71712.86562 15000 71052.63588 71220.89304 71374.77404 71515.16861 71642.87834 71758.62839 71863.0774 15500 71193.87794 71362.1351 71516.0161 71656.41068 71784.1204 71899.87045 72004.31946 16000 71326.51155 71494.76872 71648.64972 71789.04429 71916.75401 72032.50407 72136.95308 16500 71450.87438 71619.13154 71773.01254 71913.40711 72041.11683 72156.86689 72261.3159 17000 71567.28256 71735.53973 71889.42073 72029.8153 72157.52502 72273.27508 72377.72409 17500 71676.03261 71844.28978 71998.17078 72138.56535 72266.27507 72382.02512 72486.47414 18000 71777.40305 71945.66022 72099.54122 72239.93579 72367.64551 72483.39557 72587.84458 18500 71871.65593 72039.9131 72193.7941 72334.18867 72461.89839 72577.64845 72682.09746 19000 71959.03814 72127.29531 72281.17631 72421.57088 72549.2806 72665.03066 72769.47967 19500 72039.78263 72208.03979 72361.92079 72502.31536 72630.02508 72745.77514 72850.22415 Sales Expense Advertising Overhead Total other Cost $ 8,000.00 $ 10,000.00 $ 21,549.32 $ 39,549.32 $ 8,000.00 $ 10,000.00 $ 26,338.05 $ 44,338.05 $ $ $ $ 9,000.00 10,000.00 19,154.95 38,154.95 $ 9,000.00 $ 34,000.00 $ 10,000.00 $ 40,000.00 $ 28,732.42 $ 95,774.74 $ 47,732.42 $ 169,774.74 $ $ $ $ Profit Profit Margin 14,323.97 9.97% 21,507.08 12.25% 9,732.42 7.62% 24,098.63 12.58% 69662.10 10.91% Template 1 Scenario Summary Solution Sheet + X50 x for A B C D E F G H I R S T U V L M N O 19500 72039.78263 72208.03979 72361.92079 72502.31536 72630.02508 72745.77514 72850.22415 20000 72114. 10945 72282.36662 72436.24762 72576.64219 72704.35191 72820.10197 72924.55098 20500 72182.2268 72350.48396 72504.36496 72644.75953 72772.46925 72888.21931 72992.66832 21000 72244.33181 72412.58897 72566.46997 72706.86454 72834.57426 72950.32432 73054.77333 21500 72300.61142 72468.86859 72622.74959 72763.14416 72890.85388 73006.60393 73111.05295 22000 72351.24309 72519.5002572673.38125 72813.77582 72941.48555 73057.2356 73161.68461 22500 72396.39543 72564.65259 72718.53359 72858.92816 72986.63788 73102.38794 73206.83695 23000 72436.22882 72604.4859972758.3669972898.76156 73026.47128 73142.22134 73246.67035 23500 72470.89599 72639.15316 72793.03416 72933.42873 73061.13845 7 3176.88851 73281.33752 2.68064 72963.07521 73090.78494 73206.53499 7 3310.984 24500 72525.30712 72693.56428 72847.44528 72987.83986 73115.54958 73231.29963 73335.74864 25000 72545.32247 72713.57963 72867.46063 73007.8552 73135.56492 73251.31498 73355.76399 25500 72560.71518 72728.97234 72882.85334 73023.24791 73150.95763 73266.70769 7 3371.1567 26000 72571.60638 72739.86355 72893.74455 73034. 13912 73161.84884 73277.598973382.04791 26500 72578. 11202 72746.36918 72900.25018 73040.64475 73168.35447 73284.10453 73388.55354 27000 72580.34311 72748.60027 72902.48127 73042.87584 73170.58557 73286.33562 73390.78463 27500 72578.4060972746.66326 72900.54426 73040.93883 73168.64855 73284.39861 73388.84762 28000 72572.40305 72740.66022 72894.54122 73034.93579 73162.64551 73278.39557 73382.84458 28500 72562.43197 72730.68914 72884.57014 73024.96471 73152.67443 73268.4244973372.8735 29000 72548.58696 72716.8441372870.72513 73011.1197 73138.8294273254.57948 73359.02849 29500 72530.95847 72699.21564 72853.09664 72993.49121 73121.20093 73236.95099 73341.4 30000 72509.6334972677.8906572831.7716572972. 16622 73099.87594 73215.62673320.07501 30500 72484.69571 72652.95287 72806.83387 72947.22844 73074.93816 73190.68822 73295.13723 31000 72456.22572 72624.48288 72778.36388 72918.75845 73046.46817 73162.21823 73266.66724 31500 72424.30115 72592.55832 72746.43932 72886.83389 73014.54361 73130.2936773234.74268 32000 72388.99685 72557.25402 72711.13502 72851.52959 72979.23931 73094.98937 73199.43838 72350.38498 7 2518.64215 72672.52315 72812.91772 72940.62744 73056.3775 73160.82651 33000 72308.53518 72476.79235 72630.67335 72771.06792 72898.77764 73014.5277 73118.97671 63.51468 72431.7718472585.65284 72726.0474172853.75713 72969.507197 3073.9562 34000 72215.3884 72383.6455772537.52657 72677.92114 72805.63086 72921.3809173025.82993 34500 72164.2191 72332.47626 72486.35726 72626.75184 72754.46156 72870.21161 72974.66062 35000 72110.06744 72278.3246 72432.2056 72572.60017 72700.3098972816.05995 72920.50896 35500 72052.99208 72221.24925 72375.13025 72515.52482 72643.23454 72758.9846 72863.43361 36000 71993.04981 72161.30698 72315. 18798 72455.58255 72583.29227 72699.04233 72803.49134 36500 71930.29559 72098.55275 72252.43375 72392.82832 72520.53804 72636.2881 72740.73711 37000 71864.7826372033.03979 72186.92079 72327.31536 72455.02508 72570.77514 72675.22415 37500 71796.56251 71964.81967 72118.70067 72259.09524 72386.80496 72502.55502 72607.00403 38000 71725.6852 71893.94237 72047.82337 72188.21794 72315.92766 72431.6777172536.12673 38500 71652. 19918 71820.45634 71974.33734 72114.73191 72242.44163 72358.1916972462.6407 39000 71576.15143 7 1744.4086 71898.2896 72038.68417 72166.39389 72282. 14395 72386.59296 3950071497.58759 71665.84476 71819.72576 71960.1203372087.83005 72203.5801 72308.02912 40000 71416.55192 71584.80908 71738.6900871879.08465 72006.7943772122.54443 72226.99344 Template 1 Scenario Summary Solution Sheet + X50 - X fx I J K M. N O P Q 5 PARAMETERS Q2 Q3 Q4 $ $ Price Production Cost Seasonal Factor Overhead rate Sales Param 01 40.00 25.00 0.9 15% 1.1 0.8 1.2 13 14 15 35.00 3000.00 8,000.00 40,000.00 $ 8,000.00 $ 9,000.00 $ 9,000.00 Sales Expense Ad Budget $ $ $ 16 17 DECISIONS Ad Expenditures $ 10,000.00 $ 10,000.00 $ 10,000.00 $ 10,000.00 18 19 20 OUTPUT 21 Profit $ 69,662.10 Base Case $ 69,662.10 22 23 CALCULATIONS Q2 Q3 Total Units Sold Revenue Cost of Goods Gross Margin 3591.55 $ 143,662.10 $ 89,788.81 $ 53,873.29 4389.68 $ 175,587.02 $ 109,741.88 $ 65,845.13 3192.49 $ 127,699.65 $ 79,812.28 $ 47,887.37 4788.74 $ 191,549.47 $ 119,718.42 $ 71,831.05 15962.46 $ 638,498.24 $ 399,061.40 $ 239,436.84 69,662.10 8000 8500 9000 9500 10000 10500 11000 8000 67906.00922 68074.26638 68228.14738 68368.54195 68496.25167 68612.00173 68716.45074 8500 68222.76797 68391.02514 68544.90614 68685.30071 68813.01043 68928.76049 69033.2095 9000 68521.95586 68690.21303 68844.09403 68984.4886 69112.19832 69227.94838 69332.39739 9500 68804.66034 68972.9175 69126.7985 69267.19307 69394.90279 69510.65285 69615.10186 10000 69071.86111 69240.11827 69393.99927 69534.39384 69662.10356 69777.85362 69882.30263 10500 69324.44451 69492.70168 69646.58268 69786.97725 69914.68697 70030.43702 70134.88604 11000 69563.21552 69731.47269 69885.35369 70025.74826 70153.45798 70269.20804 70373.65705 11500 69788.90784 69957.16501 70111.04601 70251.44058 70379.1503 70494.90036 70599.34937 12000 70002.19242 70170.44959 70324.33059 70464.72516 70592.43488 70708.18493 70812.63395 12500 70203.68473 70371.9419 70525.8229 70666.21747 70793.92719 70909.67725 71014.12626 13000 70393.951 70562.20816 70716.08916 70856.48373 70984.19345 71099.94351 71204.39252 13500 70573.51351 70741.77068 70895.65168 71036.04625 71163.75597 71279.50603 71383.95504 14000 70742.85529 70911.11246 71064.99346 71205.38803 71333.09775 71448.84781 71553.29682 14500 70902.42409 71070.68126 71224.56226 71364.95683 71492.6665571608.4166 71712.86562 15000 71052.63588 71220.89304 71374.77404 71515.16861 71642.87834 71758.62839 71863.0774 15500 71193.87794 71362.1351 71516.0161 71656.41068 71784.1204 71899.87045 72004.31946 16000 71326.51155 71494.76872 71648.64972 71789.04429 71916.75401 72032.50407 72136.95308 16500 71450.87438 71619.13154 71773.01254 71913.40711 72041.11683 72156.86689 72261.3159 17000 71567.28256 71735.53973 71889.42073 72029.8153 72157.52502 72273.27508 72377.72409 17500 71676.03261 71844.28978 71998.17078 72138.56535 72266.27507 72382.02512 72486.47414 18000 71777.40305 71945.66022 72099.54122 72239.93579 72367.64551 72483.39557 72587.84458 18500 71871.65593 72039.9131 72193.7941 72334.18867 72461.89839 72577.64845 72682.09746 19000 71959.03814 72127.29531 72281.17631 72421.57088 72549.2806 72665.03066 72769.47967 19500 72039.78263 72208.03979 72361.92079 72502.31536 72630.02508 72745.77514 72850.22415 Sales Expense Advertising Overhead Total other Cost $ 8,000.00 $ 10,000.00 $ 21,549.32 $ 39,549.32 $ 8,000.00 $ 10,000.00 $ 26,338.05 $ 44,338.05 $ $ $ $ 9,000.00 10,000.00 19,154.95 38,154.95 $ 9,000.00 $ 34,000.00 $ 10,000.00 $ 40,000.00 $ 28,732.42 $ 95,774.74 $ 47,732.42 $ 169,774.74 $ $ $ $ Profit Profit Margin 14,323.97 9.97% 21,507.08 12.25% 9,732.42 7.62% 24,098.63 12.58% 69662.10 10.91% Template 1 Scenario Summary Solution Sheet + X50 x for A B C D E F G H I R S T U V L M N O 19500 72039.78263 72208.03979 72361.92079 72502.31536 72630.02508 72745.77514 72850.22415 20000 72114. 10945 72282.36662 72436.24762 72576.64219 72704.35191 72820.10197 72924.55098 20500 72182.2268 72350.48396 72504.36496 72644.75953 72772.46925 72888.21931 72992.66832 21000 72244.33181 72412.58897 72566.46997 72706.86454 72834.57426 72950.32432 73054.77333 21500 72300.61142 72468.86859 72622.74959 72763.14416 72890.85388 73006.60393 73111.05295 22000 72351.24309 72519.5002572673.38125 72813.77582 72941.48555 73057.2356 73161.68461 22500 72396.39543 72564.65259 72718.53359 72858.92816 72986.63788 73102.38794 73206.83695 23000 72436.22882 72604.4859972758.3669972898.76156 73026.47128 73142.22134 73246.67035 23500 72470.89599 72639.15316 72793.03416 72933.42873 73061.13845 7 3176.88851 73281.33752 2.68064 72963.07521 73090.78494 73206.53499 7 3310.984 24500 72525.30712 72693.56428 72847.44528 72987.83986 73115.54958 73231.29963 73335.74864 25000 72545.32247 72713.57963 72867.46063 73007.8552 73135.56492 73251.31498 73355.76399 25500 72560.71518 72728.97234 72882.85334 73023.24791 73150.95763 73266.70769 7 3371.1567 26000 72571.60638 72739.86355 72893.74455 73034. 13912 73161.84884 73277.598973382.04791 26500 72578. 11202 72746.36918 72900.25018 73040.64475 73168.35447 73284.10453 73388.55354 27000 72580.34311 72748.60027 72902.48127 73042.87584 73170.58557 73286.33562 73390.78463 27500 72578.4060972746.66326 72900.54426 73040.93883 73168.64855 73284.39861 73388.84762 28000 72572.40305 72740.66022 72894.54122 73034.93579 73162.64551 73278.39557 73382.84458 28500 72562.43197 72730.68914 72884.57014 73024.96471 73152.67443 73268.4244973372.8735 29000 72548.58696 72716.8441372870.72513 73011.1197 73138.8294273254.57948 73359.02849 29500 72530.95847 72699.21564 72853.09664 72993.49121 73121.20093 73236.95099 73341.4 30000 72509.6334972677.8906572831.7716572972. 16622 73099.87594 73215.62673320.07501 30500 72484.69571 72652.95287 72806.83387 72947.22844 73074.93816 73190.68822 73295.13723 31000 72456.22572 72624.48288 72778.36388 72918.75845 73046.46817 73162.21823 73266.66724 31500 72424.30115 72592.55832 72746.43932 72886.83389 73014.54361 73130.2936773234.74268 32000 72388.99685 72557.25402 72711.13502 72851.52959 72979.23931 73094.98937 73199.43838 72350.38498 7 2518.64215 72672.52315 72812.91772 72940.62744 73056.3775 73160.82651 33000 72308.53518 72476.79235 72630.67335 72771.06792 72898.77764 73014.5277 73118.97671 63.51468 72431.7718472585.65284 72726.0474172853.75713 72969.507197 3073.9562 34000 72215.3884 72383.6455772537.52657 72677.92114 72805.63086 72921.3809173025.82993 34500 72164.2191 72332.47626 72486.35726 72626.75184 72754.46156 72870.21161 72974.66062 35000 72110.06744 72278.3246 72432.2056 72572.60017 72700.3098972816.05995 72920.50896 35500 72052.99208 72221.24925 72375.13025 72515.52482 72643.23454 72758.9846 72863.43361 36000 71993.04981 72161.30698 72315. 18798 72455.58255 72583.29227 72699.04233 72803.49134 36500 71930.29559 72098.55275 72252.43375 72392.82832 72520.53804 72636.2881 72740.73711 37000 71864.7826372033.03979 72186.92079 72327.31536 72455.02508 72570.77514 72675.22415 37500 71796.56251 71964.81967 72118.70067 72259.09524 72386.80496 72502.55502 72607.00403 38000 71725.6852 71893.94237 72047.82337 72188.21794 72315.92766 72431.6777172536.12673 38500 71652. 19918 71820.45634 71974.33734 72114.73191 72242.44163 72358.1916972462.6407 39000 71576.15143 7 1744.4086 71898.2896 72038.68417 72166.39389 72282. 14395 72386.59296 3950071497.58759 71665.84476 71819.72576 71960.1203372087.83005 72203.5801 72308.02912 40000 71416.55192 71584.80908 71738.6900871879.08465 72006.7943772122.54443 72226.99344 Template 1 Scenario Summary Solution Sheet +