Answered step by step
Verified Expert Solution
Link Copied!

Question

1 Approved Answer

As shown in the picture You conduct a hypomesis test about a population mean u with the following null and alternative hypotheses: Ho: u=15.? H1:

As shown in the picture
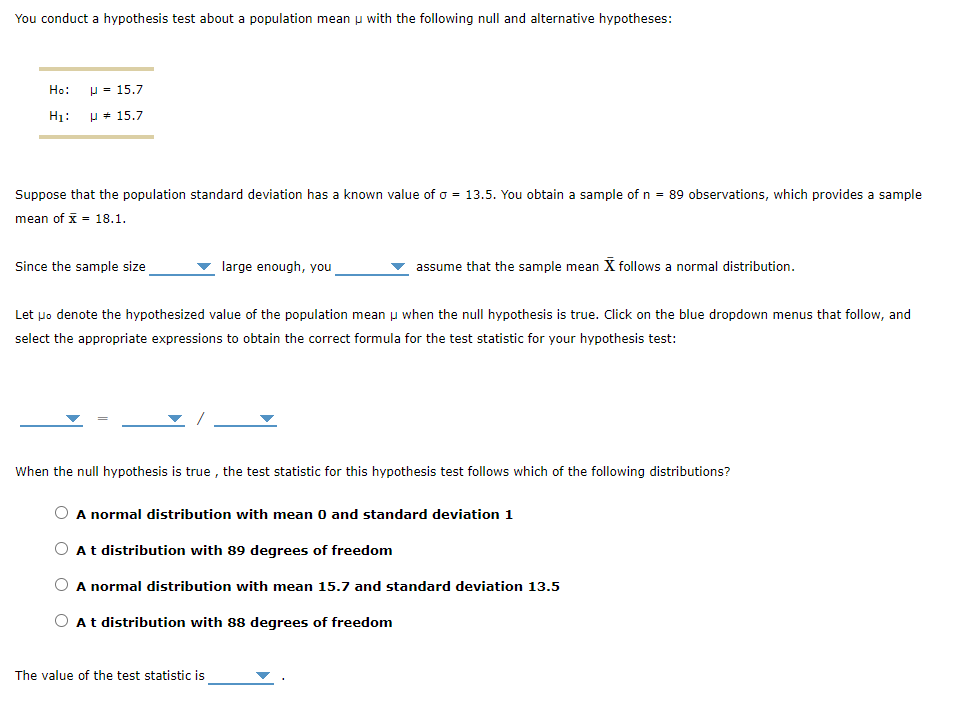
image text in transcribed
You conduct a hypomesis test about a population mean u with the following null and alternative hypotheses: Ho: u=15.? H1: u*15.? Suppose that the population standard deviation has a known value of o = 13.5. You obtain a sample of n = 89 observations, which provides a sample mean ofi = 18.1. Since the sample size V large enough, you V assume that the sample mean it follows a normal distribution. Let Llo denote the hypothesized value of the population mean u when the null hypothesis is true. Click on the blue dropdown menus that follow, and select the appropriate expressions to obtain the correct formula for the test statistic for your hypothesis test: when the null hypothesis is true , the test statistic for this hypothesis test follows which of the following distributions? 0 A normal distribution with mean I] and standard deviation 1 O A t distribution with 89 degrees of freedom 0 A normal distribution with mean 15.? and standard deviation 13.5 0 A t distribution with as degrees of freedom The value of the test statistic is V

Step by Step Solution

There are 3 Steps involved in it

Step: 1

blur-text-image

Get Instant Access to Expert-Tailored Solutions

See step-by-step solutions with expert insights and AI powered tools for academic success

Step: 2

blur-text-image

Step: 3

blur-text-image

Ace Your Homework with AI

Get the answers you need in no time with our AI-driven, step-by-step assistance

Get Started

Recommended Textbook for

Quantitative Analysis For Management

Authors: Barry Render, Ralph M. Stair, Michael E. Hanna

11th Edition

9780132997621, 132149117, 132997622, 978-0132149112

Students also viewed these Mathematics questions