

Answered step by step
Verified Expert Solution
Question
1 Approved Answer
As stated in the screenshot, we are to use Data Tables to solve these questions. Looking for an explanation that can help guide me through
As stated in the screenshot, we are to use Data Tables to solve these questions. Looking for an explanation that can help guide me through so I am more capable.
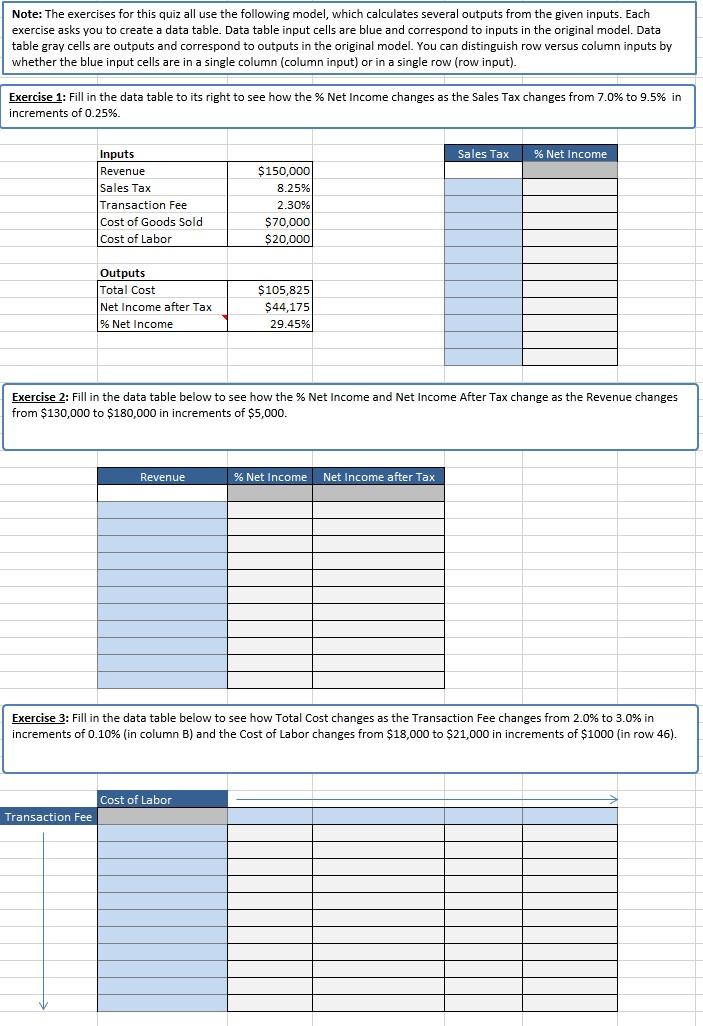
Note: The exercises for this quiz all use the following model, which calculates several outputs from the given inputs. Each exercise asks you to create a data table. Data table input cells are blue and correspond to inputs in the original model. Data table gray cells are outputs and correspond to outputs in the original model. You can distinguish row versus column inputs by whether the blue input cells are in a single column (column input) or in a single row (row input). Exercise 1: Fill in the data table to its right to see how the % Net Income changes as the Sales Tax changes from 7.0% to 9.5% in increments of 0.25%. Sales Tax % Net Income Inputs Revenue Sales Tax Transaction Fee Cost of Goods Sold Cost of Labor $150,000 8.25% 2.30% $70,000 $ 20,000 Outputs Total Cost Net Income after Tax % Net Income $105,825 $44,175 29.45% Exercise 2: Fill in the data table below to see how the % Net Income and Net Income After Tax change as the Revenue changes from $130,000 to $180,000 in increments of $5,000. Revenue % Net Income Net Income after Tax Exercise 3: Fill in the data table below to see how Total Cost changes as the Transaction Fee changes from 2.0% to 3.0% in increments of 0.10% (in column B) and the Cost of Labor changes from $18,000 to $21,000 in increments of $1000 (in row 46). Cost of Labor Transaction FeeStep by Step Solution
There are 3 Steps involved in it
Step: 1

Get Instant Access to Expert-Tailored Solutions
See step-by-step solutions with expert insights and AI powered tools for academic success
Step: 2

Step: 3
Ace Your Homework with AI
Get the answers you need in no time with our AI-driven, step-by-step assistance
Get Started
Management Audits For Excellence
Authors: Dorsey J. Talley
1st Edition
0873890396, 978-0873890397