Question
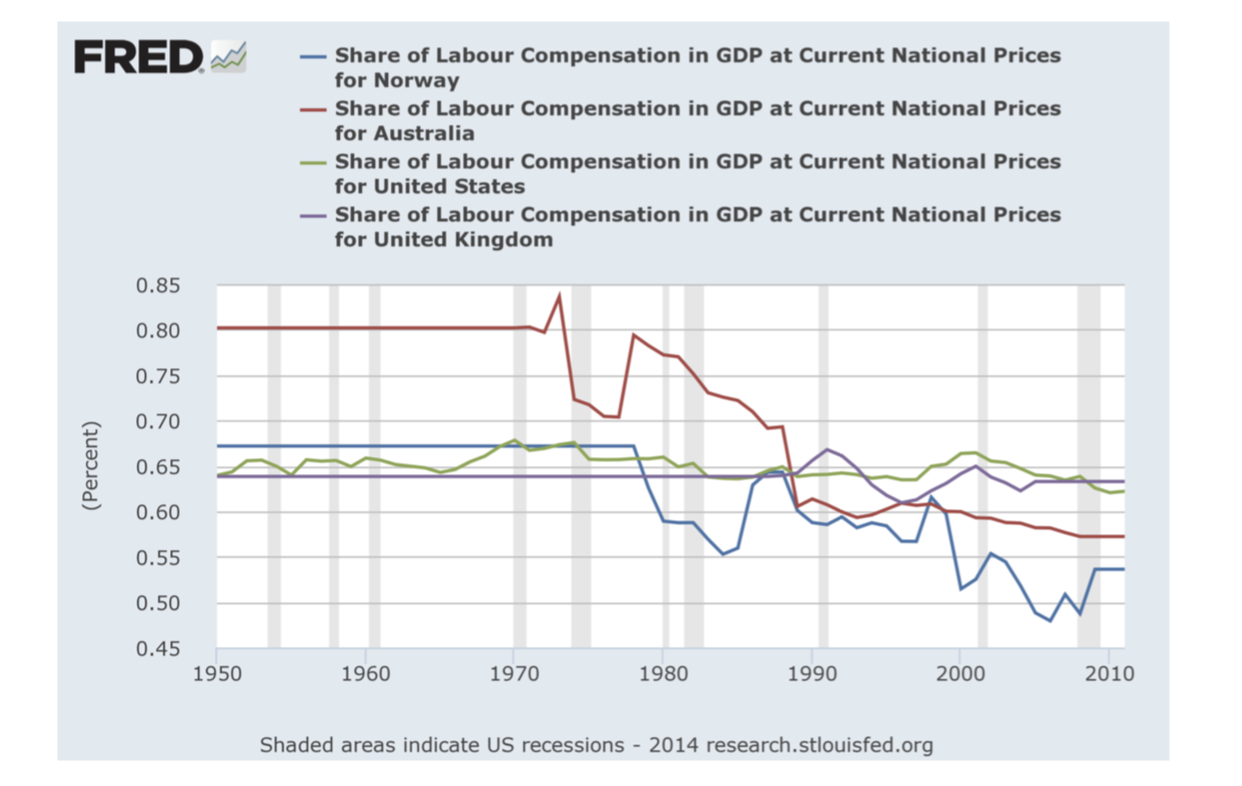
As you can see in the graph below7, labour compensation as a share of GDP in the USA and the UK for the past 60
As you can see in the graph below7, labour compensation as a share of GDP in the USA and the UK for the past 60 years has been relatively constant at around 2/3. Labour compensation in Norway and Australia, however, having been higher than the UK/US levels in the 1950s and 1960s, started to fall dramatically in the 1970s. Since the mid 1990s, the compensation shares in Australia and Norway have been consistently lower than the British and American levels. According to the theory developed in the textbook (and in earlier questions) what factors could potentially explain these trends?
?

Step by Step Solution
There are 3 Steps involved in it
Step: 1

Get Instant Access to Expert-Tailored Solutions
See step-by-step solutions with expert insights and AI powered tools for academic success
Step: 2

Step: 3

Ace Your Homework with AI
Get the answers you need in no time with our AI-driven, step-by-step assistance
Get Started


