

Answered step by step
Verified Expert Solution
Question
1 Approved Answer
asap please 1. Some diversification benefits can be achieved by combining securities in a portfolio as long as the correlation between the securities is a.
asap please
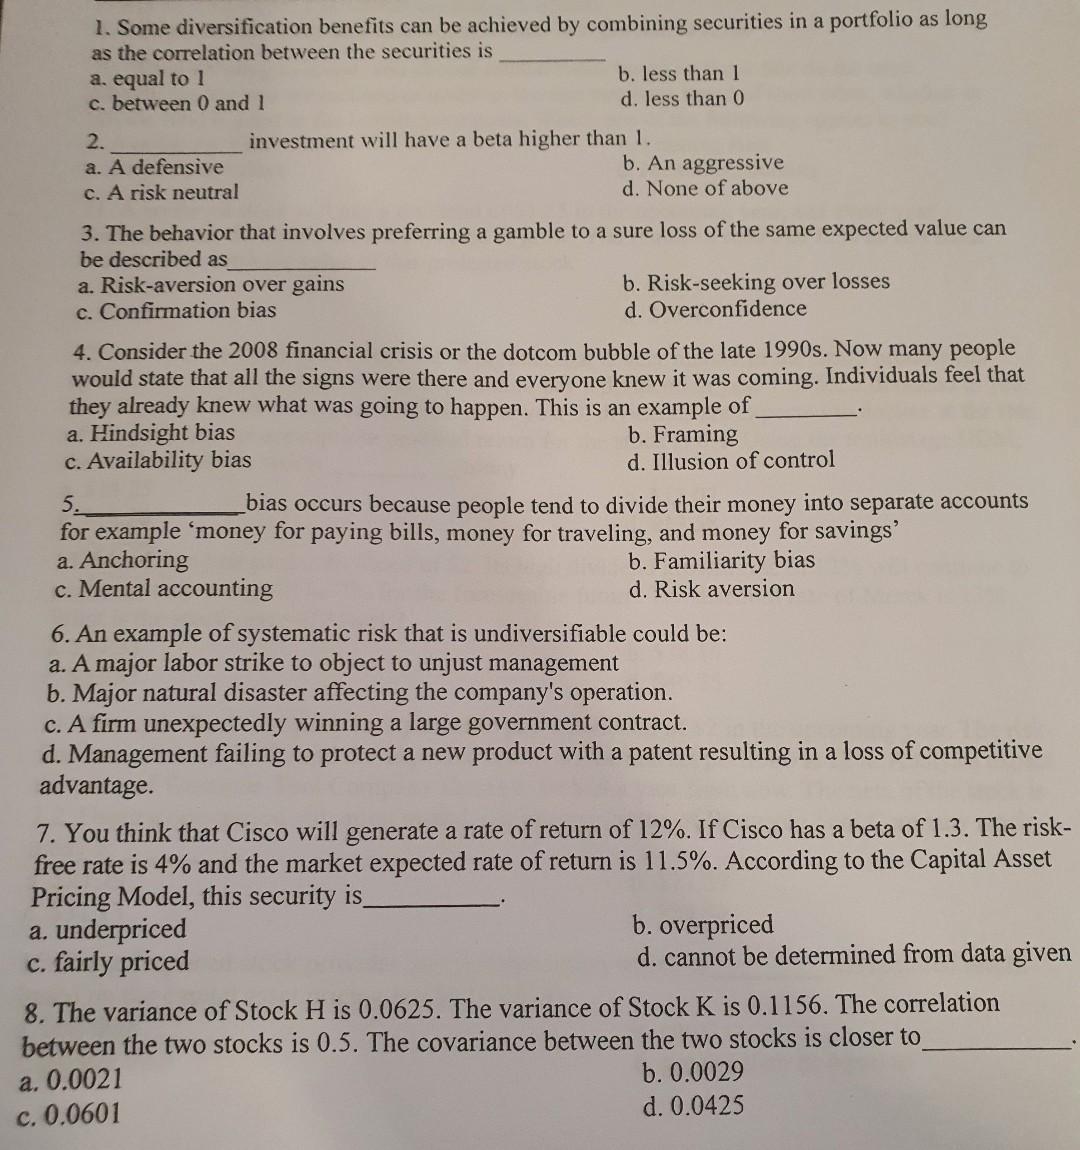
1. Some diversification benefits can be achieved by combining securities in a portfolio as long as the correlation between the securities is a. equal to 1 b. less than 1 c. between 0 and 1 d. less than 0 2. investment will have a beta higher than 1 . a. A defensive b. An aggressive c. A risk neutral d. None of above 3. The behavior that involves preferring a gamble to a sure loss of the same expected value can be described as a. Risk-aversion over gains b. Risk-seeking over losses c. Confirmation bias d. Overconfidence 4. Consider the 2008 financial crisis or the dotcom bubble of the late 1990 s. Now many people would state that all the signs were there and everyone knew it was coming. Individuals feel that they already knew what was going to happen. This is an example of a. Hindsight bias b. Framing c. Availability bias d. Illusion of control 5. bias occurs because people tend to divide their money into separate accounts for example 'money for paying bills, money for traveling, and money for savings' a. Anchoring b. Familiarity bias c. Mental accounting d. Risk aversion 6. An example of systematic risk that is undiversifiable could be: a. A major labor strike to object to unjust management b. Major natural disaster affecting the company's operation. c. A firm unexpectedly winning a large government contract. d. Management failing to protect a new product with a patent resulting in a loss of competitive advantage. 7. You think that Cisco will generate a rate of return of 12%. If Cisco has a beta of 1.3 . The riskfree rate is 4% and the market expected rate of return is 11.5%. According to the Capital Asset Pricing Model, this security is a. underpriced b. overpriced c. fairly priced d. cannot be determined from data given 8. The variance of Stock H is 0.0625 . The variance of Stock K is 0.1156 . The correlation between the two stocks is 0.5 . The covariance between the two stocks is closer to a. 0.0021 b. 0.0029 c. 0.0601 d. 0.0425Step by Step Solution
There are 3 Steps involved in it
Step: 1

Get Instant Access to Expert-Tailored Solutions
See step-by-step solutions with expert insights and AI powered tools for academic success
Step: 2

Step: 3
Ace Your Homework with AI
Get the answers you need in no time with our AI-driven, step-by-step assistance
Get Started
Business Finance
Authors: Brian Watts
8th Edition
0712110720, 978-0712110723