Question
Ashe Ltd is manufacturer of organic health and nutrition products. Initially a family owned business based in London, it has grown due to increased demand


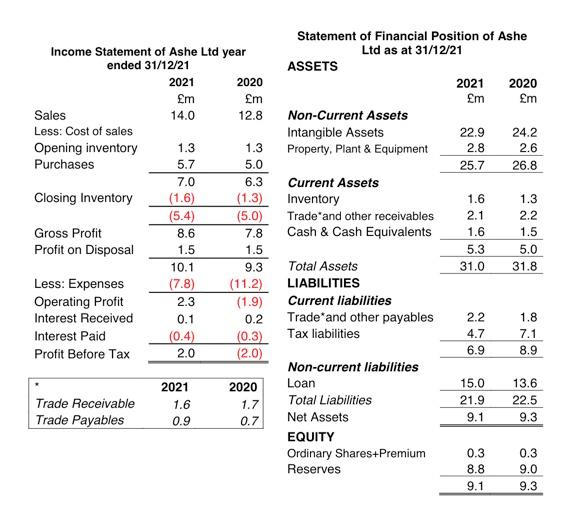
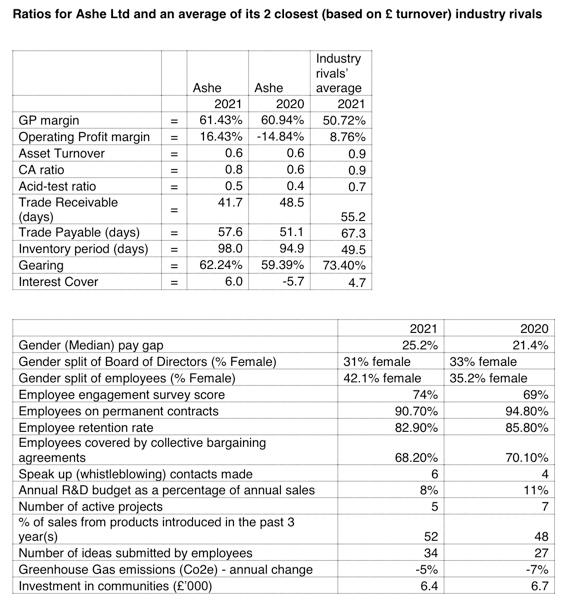
Ashe Ltd is manufacturer of organic health and nutrition products. Initially a family owned business based in London, it has grown due to increased demand in health related products and by merging with other companies. It now has manufacturing sites in the rest of the United Kingdom and also Eastern Europe. You have been provided with extracts from the financial statements, and also financial ratios for the last 2 years, along with along with comparative figures of its 2 closest industry rivals. You have also been provided with non-financial Key Performance Indicators for Ashe, for the last 2 years, found in its annual report.
Required: Using this information provided, analyse the performance and position of Ashe Ltd in 2021, from the point of view of an investor, making suggestions for action in 2022. In addition, analyse the performance of the company from the point of view of other stakeholders, such as employees and customers.
Income Statement of Ashe Ltd year ended 31/12/21 2021 2020 m Em Sales 14.0 12.8 Less: Cost of sales Opening inventory 1.3 1.3 Purchases 5.7 5.0 7.0 6.3 Closing Inventory (1.6) (1.3) (5.4) (5.0) Gross Profit 8.6 7.8 Profit on Disposal 1.5 1.5 10.1 9.3 Less: Expenses (7.8) (11.2) Operating Profit 2.3 (1.9) Interest Received 0.1 0.2 Interest Paid (0.4) (0.3) Profit Before Tax 2.0 (2.0) Statement of Financial Position of Ashe Ltd as at 31/12/21 ASSETS 2021 2020 m m Non-Current Assets Intangible Assets 22.9 24.2 Property, Plant & Equipment 2.8 2.6 25.7 26.8 Current Assets Inventory 1.6 1.3 Trade and other receivables 2.1 2.2 Cash & Cash Equivalents 1.6 1.5 5.3 5.0 Total Assets 31.0 31.8 LIABILITIES Current liabilities Trade and other payables 2.2 1.8 Tax liabilities 4.7 7.1 6.9 8.9 Non-current liabilities Loan 15.0 13.6 Total Liabilities 21.9 22.5 Net Assets 9.1 9.3 EQUITY Ordinary Shares Premium 0.3 0.3 Reserves 8.8 9.0 9.1 9.3 No Trade Receivable Trade Payables 2021 1.6 0.9 2020 1.7 0.7 Ratios for Ashe Ltd and an average of its 2 closest (based on turnover) industry rivals II II II III = Industry rivals Ashe Ashe average 2021 2020 2021 61.43% 60.94% 50.72% 16.43% -14.84% 8.76% 0.6 0.6 0.9 0.8 0.6 0.9 0.5 0.4 0.7 41.7 48.5 55.2 57.6 51.1 67.3 98.0 94.9 49.5 62.24% 59.39% 73.40% 6.0 -5.7 4.7 GP margin Operating Profit margin Asset Turnover CA ratio Acid-test ratio Trade Receivable (days) Trade Payable (days) Inventory period (days) Gearing Interest Cover = = II II II II = 2021 25.2% 31% female 42.1% female 74% 90.70% 82.90% 2020 21.4% 33% female 35.2% female 69% 94.80% 85.80% Gender (Median) pay gap Gender split of Board of Directors (% Female) Gender split of employees (% Female) Employee engagement survey score Employees on permanent contracts Employee retention rate Employees covered by collective bargaining agreements Speak up (whistleblowing) contacts made Annual R&D budget as a percentage of annual sales Number of active projects % of sales from products introduced in the past 3 year(s) Number of ideas submitted by employees Greenhouse Gas emissions (Co2e) - annual change Investment in communities ('000) 68.20% 6 8% 5 70.10% 4 11% 7 52 34 -5% 6.4 48 27 -7% 6.7 Income Statement of Ashe Ltd year ended 31/12/21 2021 2020 m Em Sales 14.0 12.8 Less: Cost of sales Opening inventory 1.3 1.3 Purchases 5.7 5.0 7.0 6.3 Closing Inventory (1.6) (1.3) (5.4) (5.0) Gross Profit 8.6 7.8 Profit on Disposal 1.5 1.5 10.1 9.3 Less: Expenses (7.8) (11.2) Operating Profit 2.3 (1.9) Interest Received 0.1 0.2 Interest Paid (0.4) (0.3) Profit Before Tax 2.0 (2.0) Statement of Financial Position of Ashe Ltd as at 31/12/21 ASSETS 2021 2020 m m Non-Current Assets Intangible Assets 22.9 24.2 Property, Plant & Equipment 2.8 2.6 25.7 26.8 Current Assets Inventory 1.6 1.3 Trade and other receivables 2.1 2.2 Cash & Cash Equivalents 1.6 1.5 5.3 5.0 Total Assets 31.0 31.8 LIABILITIES Current liabilities Trade and other payables 2.2 1.8 Tax liabilities 4.7 7.1 6.9 8.9 Non-current liabilities Loan 15.0 13.6 Total Liabilities 21.9 22.5 Net Assets 9.1 9.3 EQUITY Ordinary Shares Premium 0.3 0.3 Reserves 8.8 9.0 9.1 9.3 No Trade Receivable Trade Payables 2021 1.6 0.9 2020 1.7 0.7 Ratios for Ashe Ltd and an average of its 2 closest (based on turnover) industry rivals II II II III = Industry rivals Ashe Ashe average 2021 2020 2021 61.43% 60.94% 50.72% 16.43% -14.84% 8.76% 0.6 0.6 0.9 0.8 0.6 0.9 0.5 0.4 0.7 41.7 48.5 55.2 57.6 51.1 67.3 98.0 94.9 49.5 62.24% 59.39% 73.40% 6.0 -5.7 4.7 GP margin Operating Profit margin Asset Turnover CA ratio Acid-test ratio Trade Receivable (days) Trade Payable (days) Inventory period (days) Gearing Interest Cover = = II II II II = 2021 25.2% 31% female 42.1% female 74% 90.70% 82.90% 2020 21.4% 33% female 35.2% female 69% 94.80% 85.80% Gender (Median) pay gap Gender split of Board of Directors (% Female) Gender split of employees (% Female) Employee engagement survey score Employees on permanent contracts Employee retention rate Employees covered by collective bargaining agreements Speak up (whistleblowing) contacts made Annual R&D budget as a percentage of annual sales Number of active projects % of sales from products introduced in the past 3 year(s) Number of ideas submitted by employees Greenhouse Gas emissions (Co2e) - annual change Investment in communities ('000) 68.20% 6 8% 5 70.10% 4 11% 7 52 34 -5% 6.4 48 27 -7% 6.7Step by Step Solution
There are 3 Steps involved in it
Step: 1

Get Instant Access to Expert-Tailored Solutions
See step-by-step solutions with expert insights and AI powered tools for academic success
Step: 2

Step: 3

Ace Your Homework with AI
Get the answers you need in no time with our AI-driven, step-by-step assistance
Get Started


