

Question
Assessing how well a companys strategy is presently working involves evaluating the strategy from a qualitative standpoint and a quantitative standpoint. The stronger a companys
Assessing how well a companys strategy is presently working involves evaluating the strategy from a qualitative standpoint and a quantitative standpoint. The stronger a companys current overall performance, the less likely the need for radical strategy changes. The weaker a companys performance, the more its current strategy must be questioned.
The goal of this exercise is for you to understand how well a companys strategy is working based on its financial results.
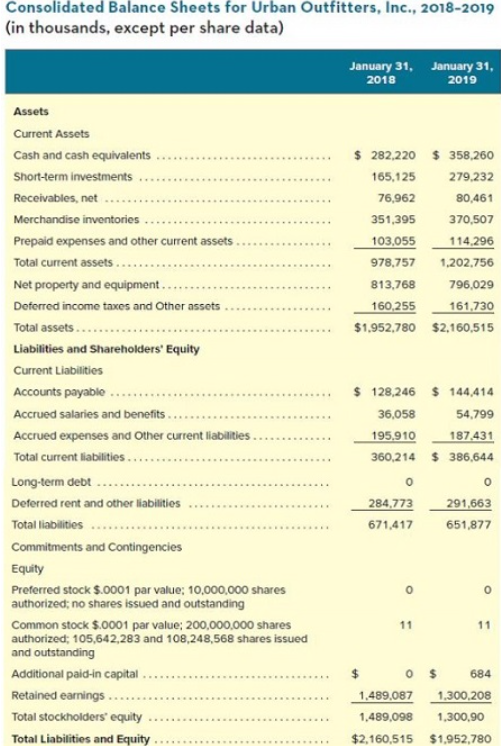
Before completing this exercise, be sure to review Chapter 4, Evaluating a Companys Resources, Capabilities, and Competitiveness, as well as Table 4.1, Key Financial Ratios: How to Calculate Them and What They Mean, which provides a compilation of the financial ratios most used to evaluate a companys financial performance and balance sheet strength. You will also need the Urban Outfitters financial statements presented below.
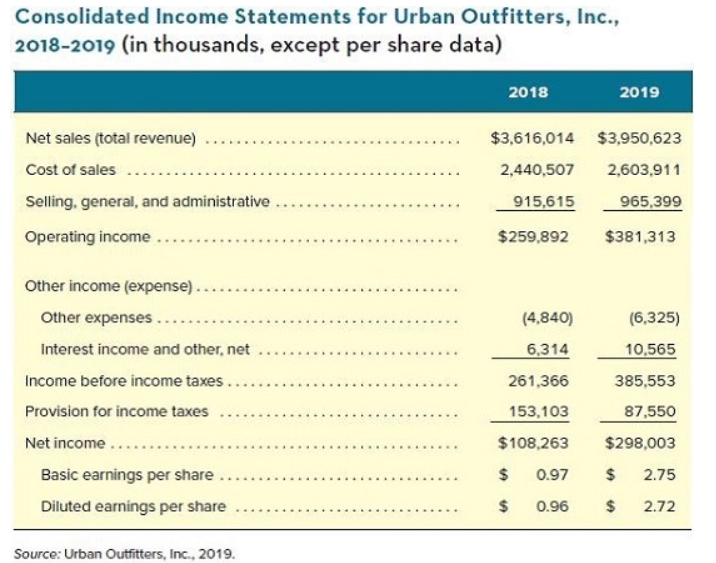
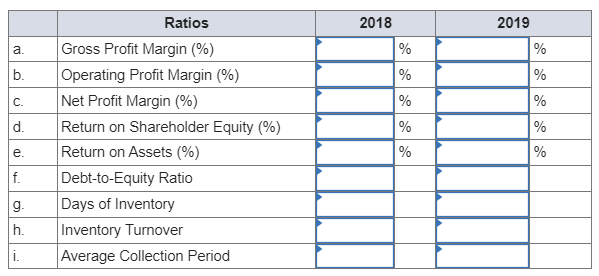
Calculate the following ratios for Urban Outfitters for both 2018 and 2019. Be sure to report items (a) through (e) in percentages (i.e., multiply your result 100).
a. Gross profit margin
b. Operating profit margin
c. Net profit margin
d. Return on stockholders equity
e. Return on assets
f. Debt-to-equity ratio
g. Days of inventory
h. Inventory turnover ratio
i. Average collection period
(Round your answer to 1 decimal place.)
 Consolidated Income Statements for Urban Outfitters, Inc., 1... 1. ........ Source: Urdan Uuthtters, inc., z1y. Consolidated Balance Sheets for Urban Outfitters, Inc., 2018-2019 \begin{tabular}{|l|l|c|l|l|l|} \hline & \multicolumn{1}{|c|}{ Ratios } & \multicolumn{1}{c|}{2018} & \multicolumn{2}{c|}{2019} \\ \hline a. & Gross Profit Margin (\%) & & % & & % \\ \hline b. & Operating Profit Margin (\%) & & % & & % \\ \hline c. & Net Profit Margin (\%) & & % & & % \\ \hline d. & Return on Shareholder Equity (\%) & & % & & % \\ \hline e. & Return on Assets (\%) & & % & & % \\ \hline f. & Debt-to-Equity Ratio & & & & \\ \hline g. & Days of Inventory & & & \\ \hline h. & Inventory Turnover & & & & \\ \hline i. & Average Collection Period & & & \\ \hline \end{tabular} Consolidated Income Statements for Urban Outfitters, Inc., 1... 1. ........ Source: Urdan Uuthtters, inc., z1y. Consolidated Balance Sheets for Urban Outfitters, Inc., 2018-2019 \begin{tabular}{|l|l|c|l|l|l|} \hline & \multicolumn{1}{|c|}{ Ratios } & \multicolumn{1}{c|}{2018} & \multicolumn{2}{c|}{2019} \\ \hline a. & Gross Profit Margin (\%) & & % & & % \\ \hline b. & Operating Profit Margin (\%) & & % & & % \\ \hline c. & Net Profit Margin (\%) & & % & & % \\ \hline d. & Return on Shareholder Equity (\%) & & % & & % \\ \hline e. & Return on Assets (\%) & & % & & % \\ \hline f. & Debt-to-Equity Ratio & & & & \\ \hline g. & Days of Inventory & & & \\ \hline h. & Inventory Turnover & & & & \\ \hline i. & Average Collection Period & & & \\ \hline \end{tabular}
 Step by Step Solution
There are 3 Steps involved in it
Step: 1

Get Instant Access to Expert-Tailored Solutions
See step-by-step solutions with expert insights and AI powered tools for academic success
Step: 2

Step: 3
Ace Your Homework with AI
Get the answers you need in no time with our AI-driven, step-by-step assistance
Get Started
FINANCIAL ACCOUNTING AND COSTING
Authors: Meera Gopi Krishna
1st Edition
979-8604687369