Answered step by step
Verified Expert Solution
Question
1 Approved Answer
Assessing Normality Guinea pig survival times: Scientists conducted an experiment using guinea pigs and tracked their survival times (in days) after they were injected with
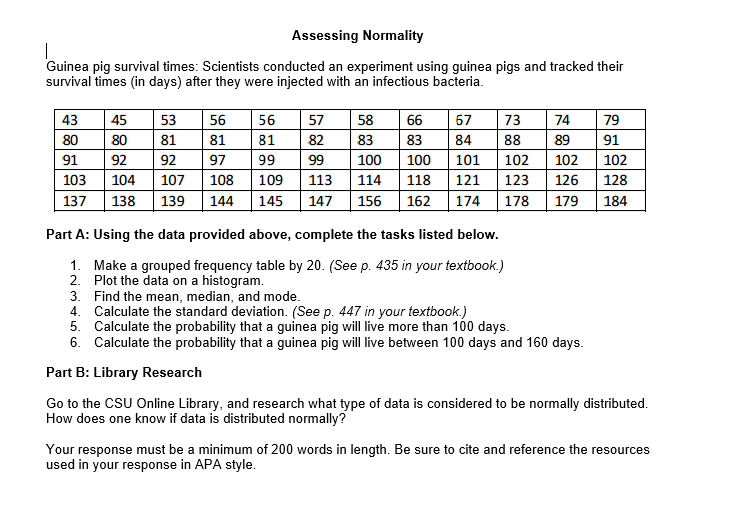
Assessing Normality Guinea pig survival times: Scientists conducted an experiment using guinea pigs and tracked their survival times (in days) after they were injected with an infectious bacteria. 43 45 53 56 56 57 58 66 67 73 74 79 80 80 81 81 81 82 83 83 84 88 89 91 91 92 92 97 99 99 100 100 101 102 102 102 103 104 107 108 109 113 114 118 121 123 126 128 137 138 139 144 145 147 156 162 174 178 179 184 Part A: Using the data provided above, complete the tasks listed below. Make a grouped frequency table by 20. (See p. 435 in your textbook.) 2. Plot the data on a histogram. 3. Find the mean, median, and mode. 4. Calculate the standard deviation. (See p. 447 in your textbook.) 5. Calculate the probability that a guinea pig will live more than 100 days. 6. Calculate the probability that a guinea pig will live between 100 days and 160 days. Part B: Library Research Go to the CSU Online Library, and research what type of data is considered to be normally distributed. How does one know if data is distributed normally? Your response must be a minimum of 200 words in length. Be sure to cite and reference the resources used in your response in APA style
Step by Step Solution
There are 3 Steps involved in it
Step: 1
Get Instant Access to Expert-Tailored Solutions
See step-by-step solutions with expert insights and AI powered tools for academic success
Step: 2
Step: 3
Ace Your Homework with AI
Get the answers you need in no time with our AI-driven, step-by-step assistance
Get Started