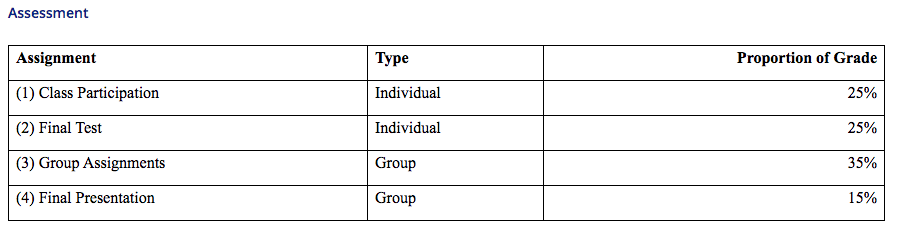
Assessment Assignment Type Proportion of Grade (1) Class Participation Individual 25% (2) Final Test Individual 25% (3) Group Assignments Group 35% (4) Final Presentation Group
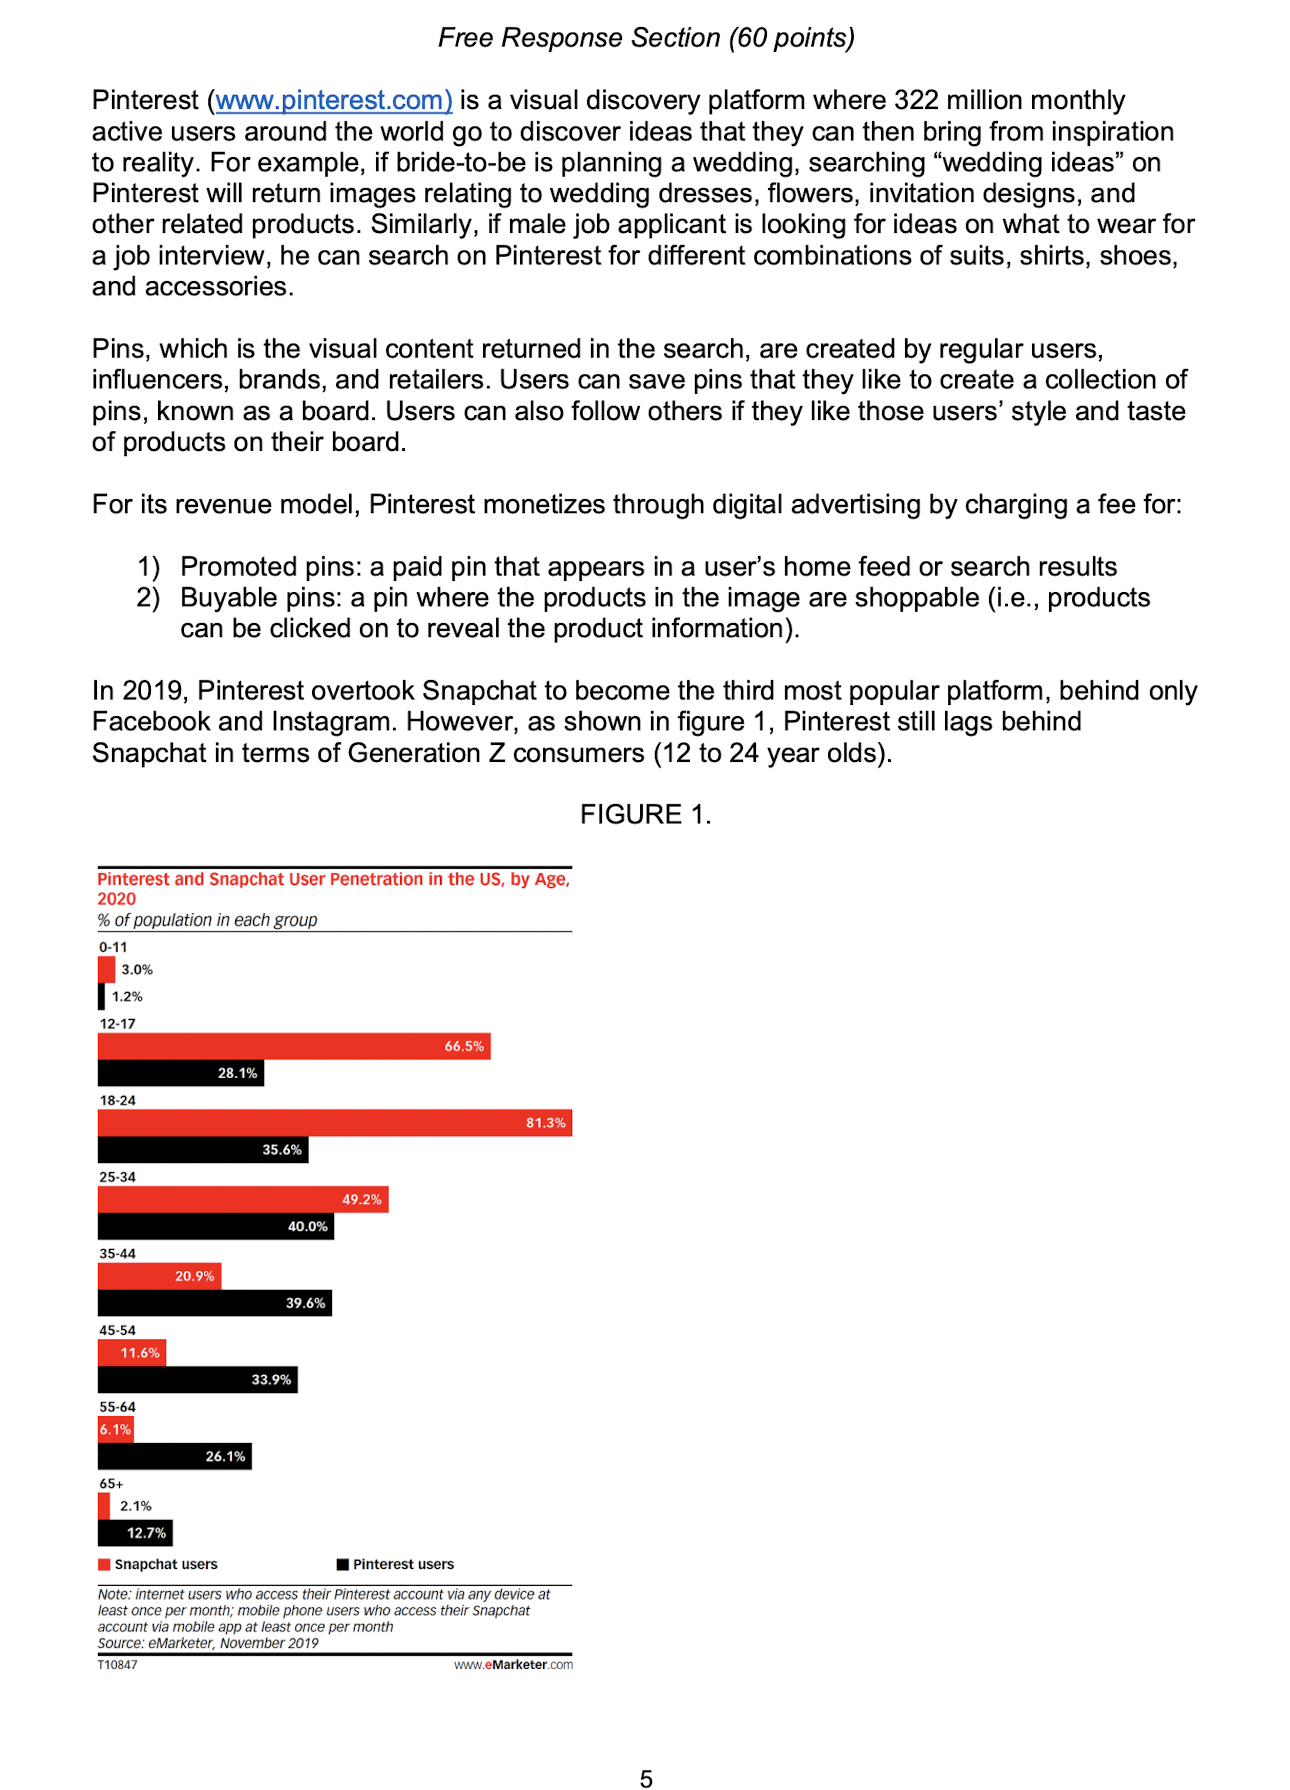
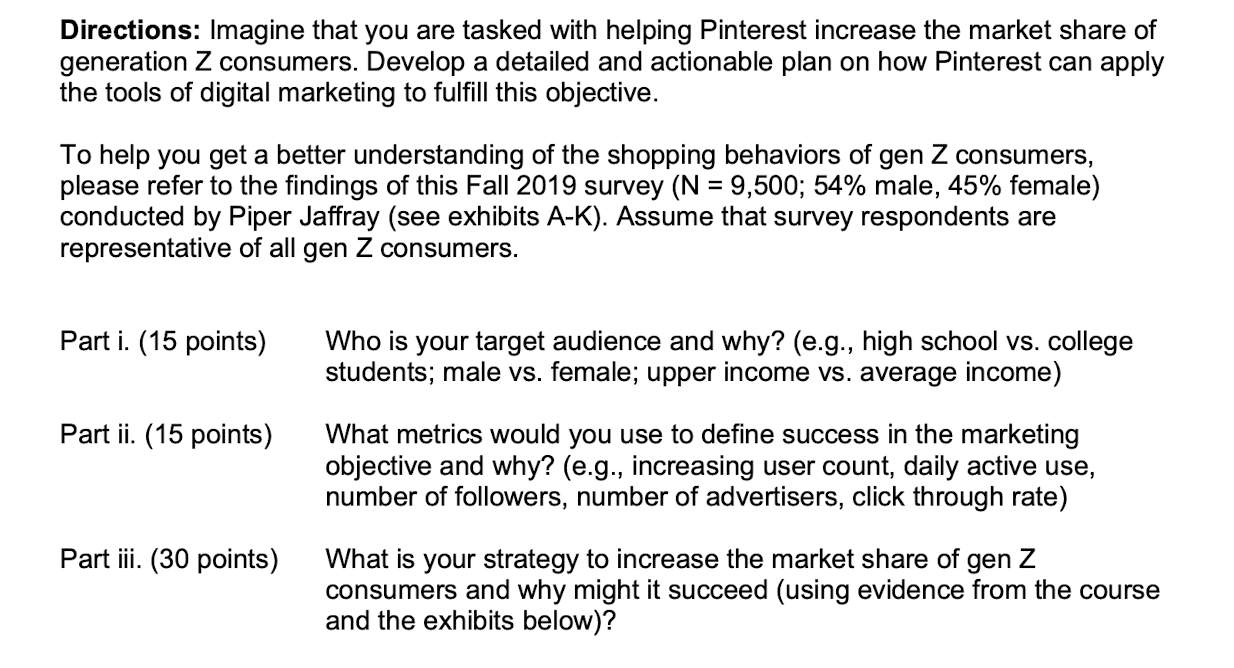
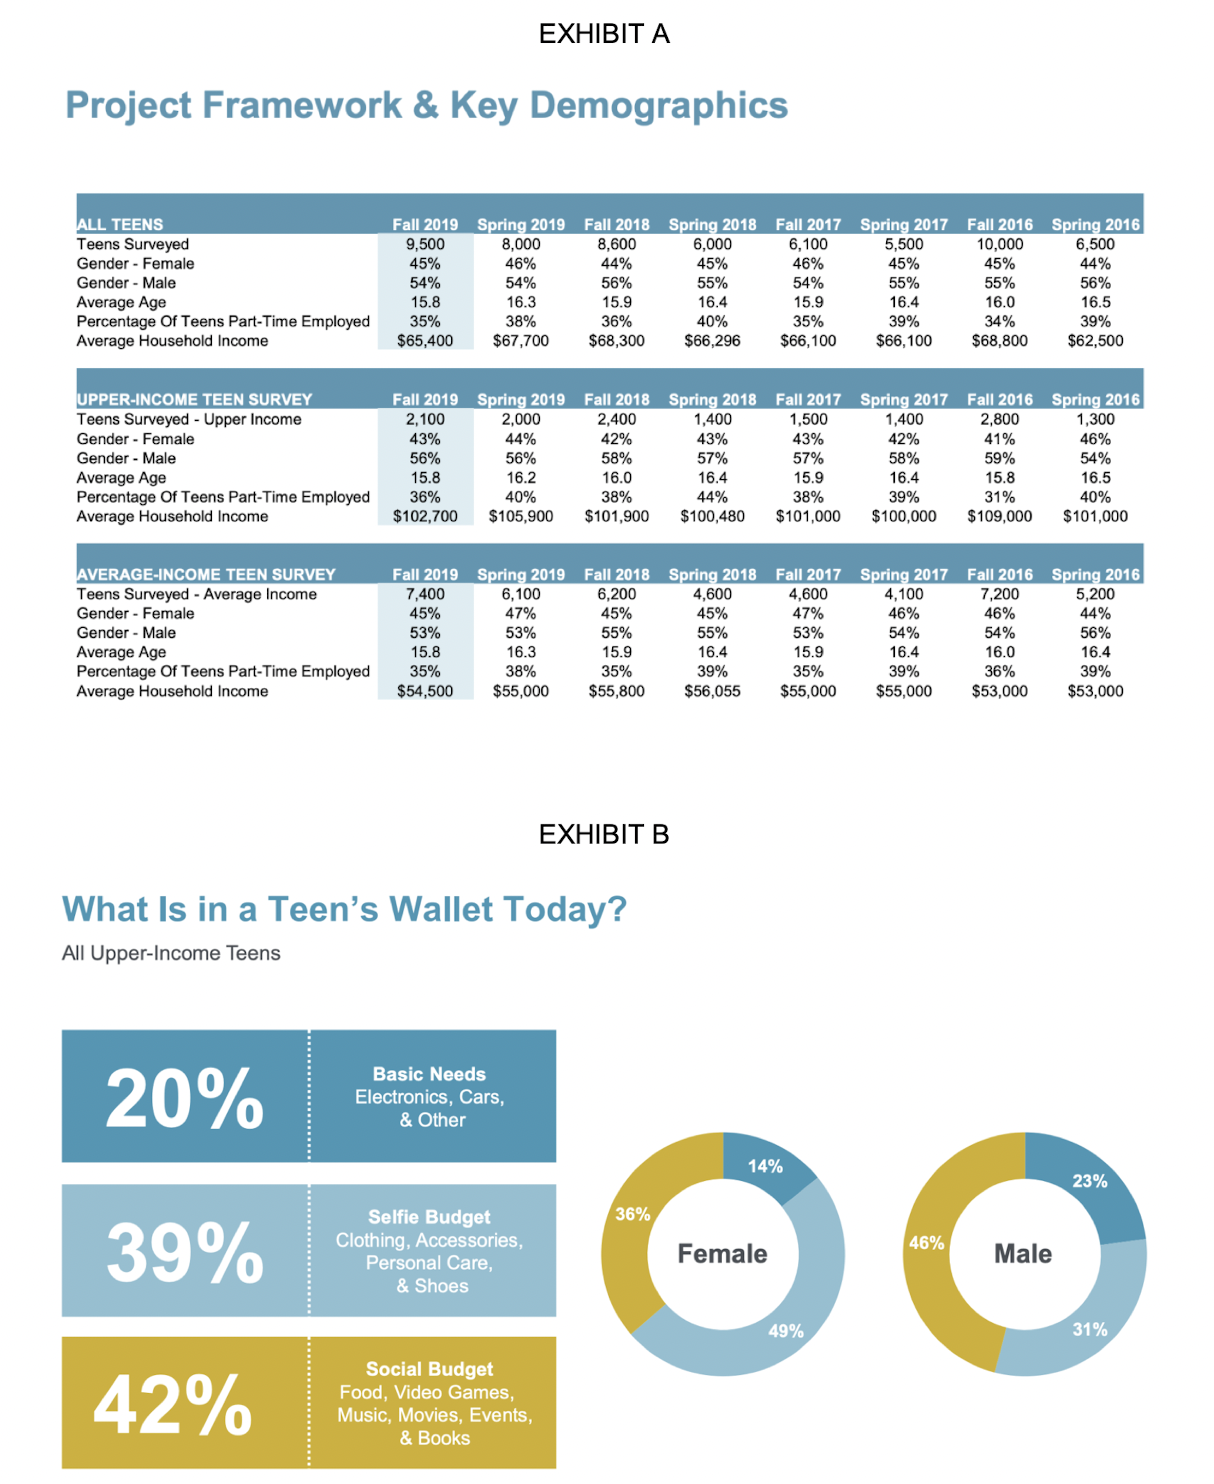
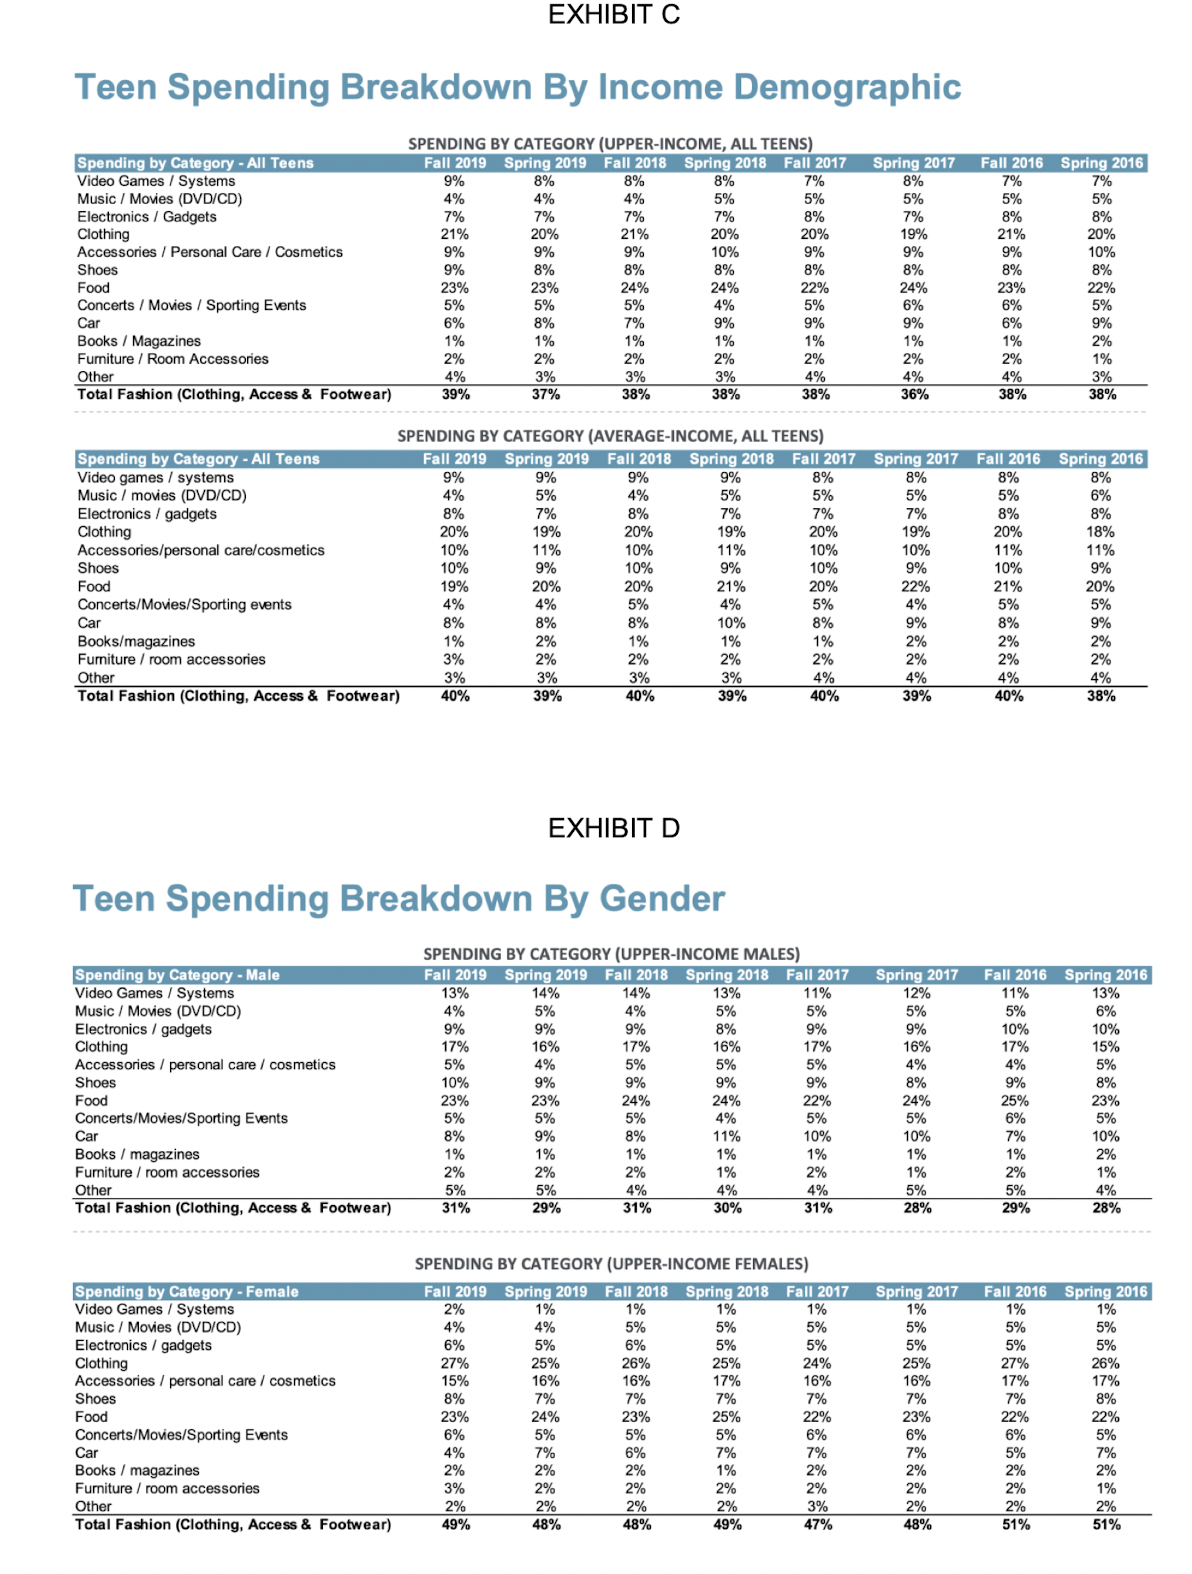
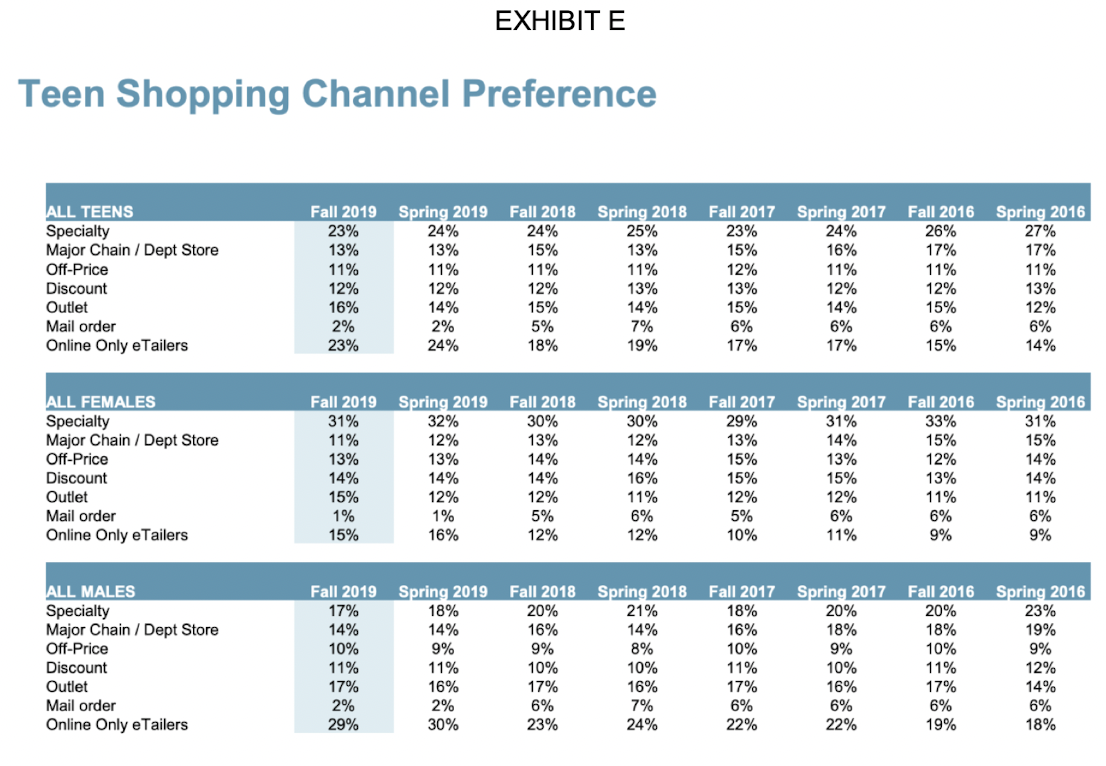
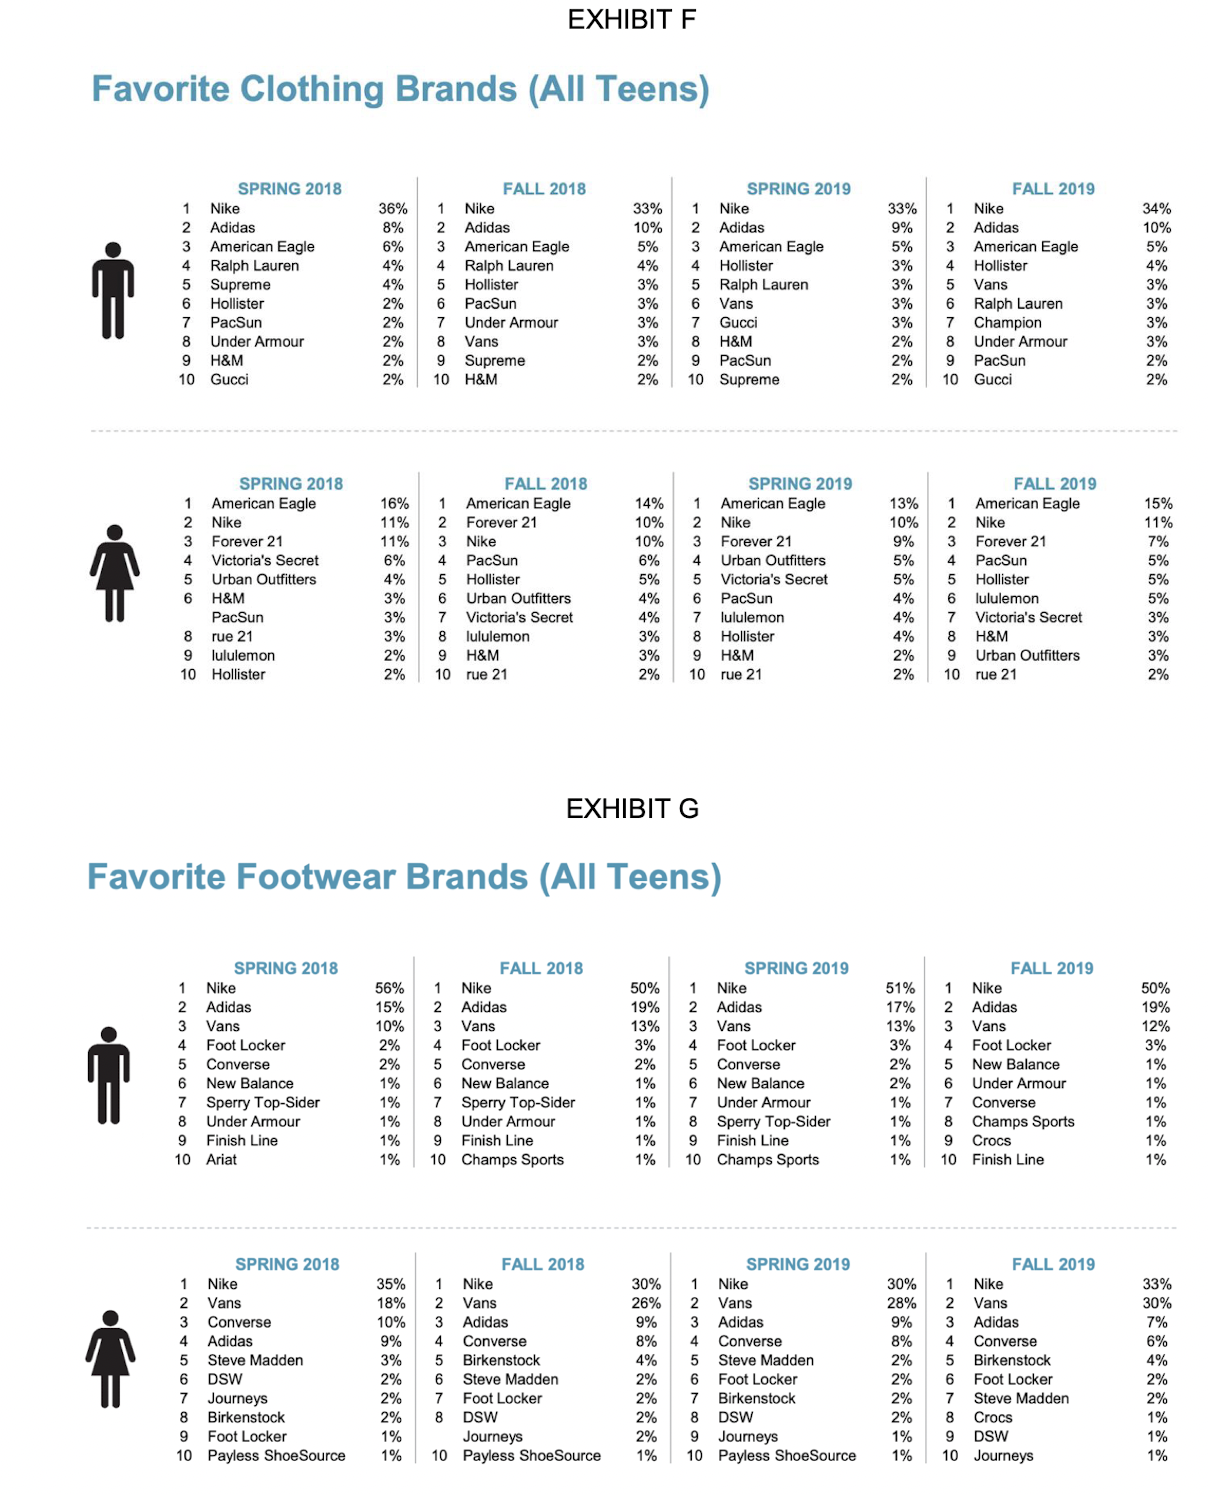
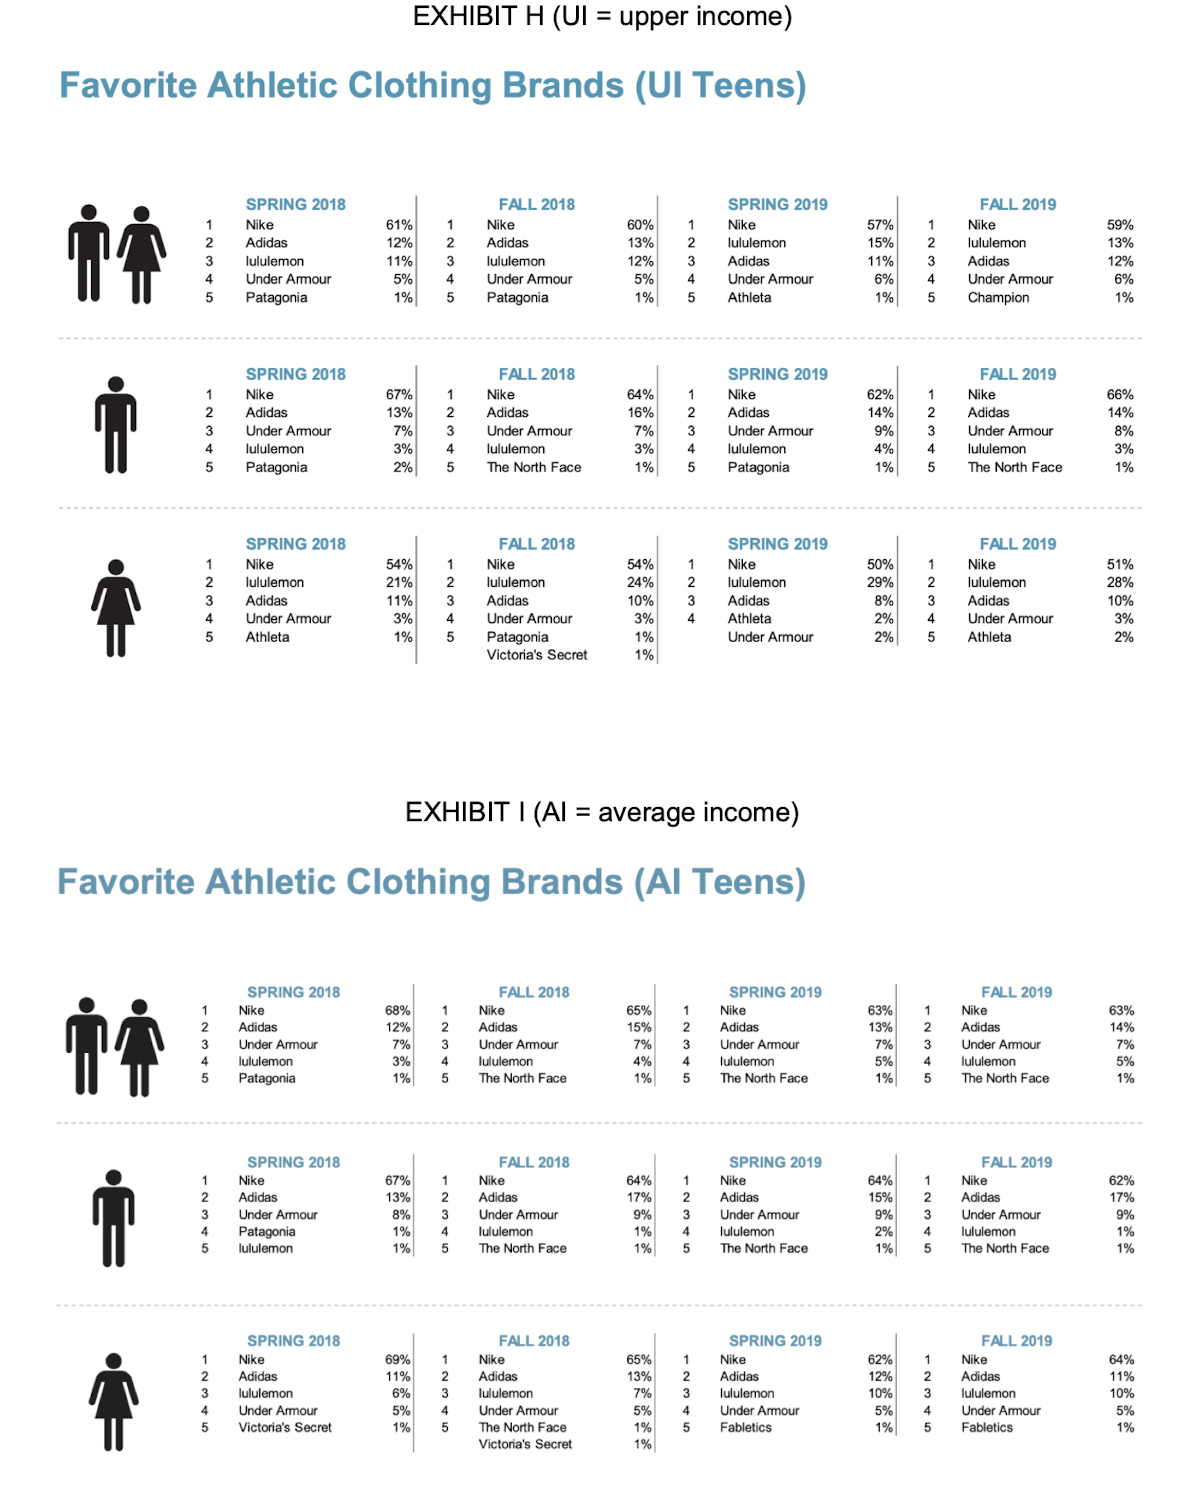
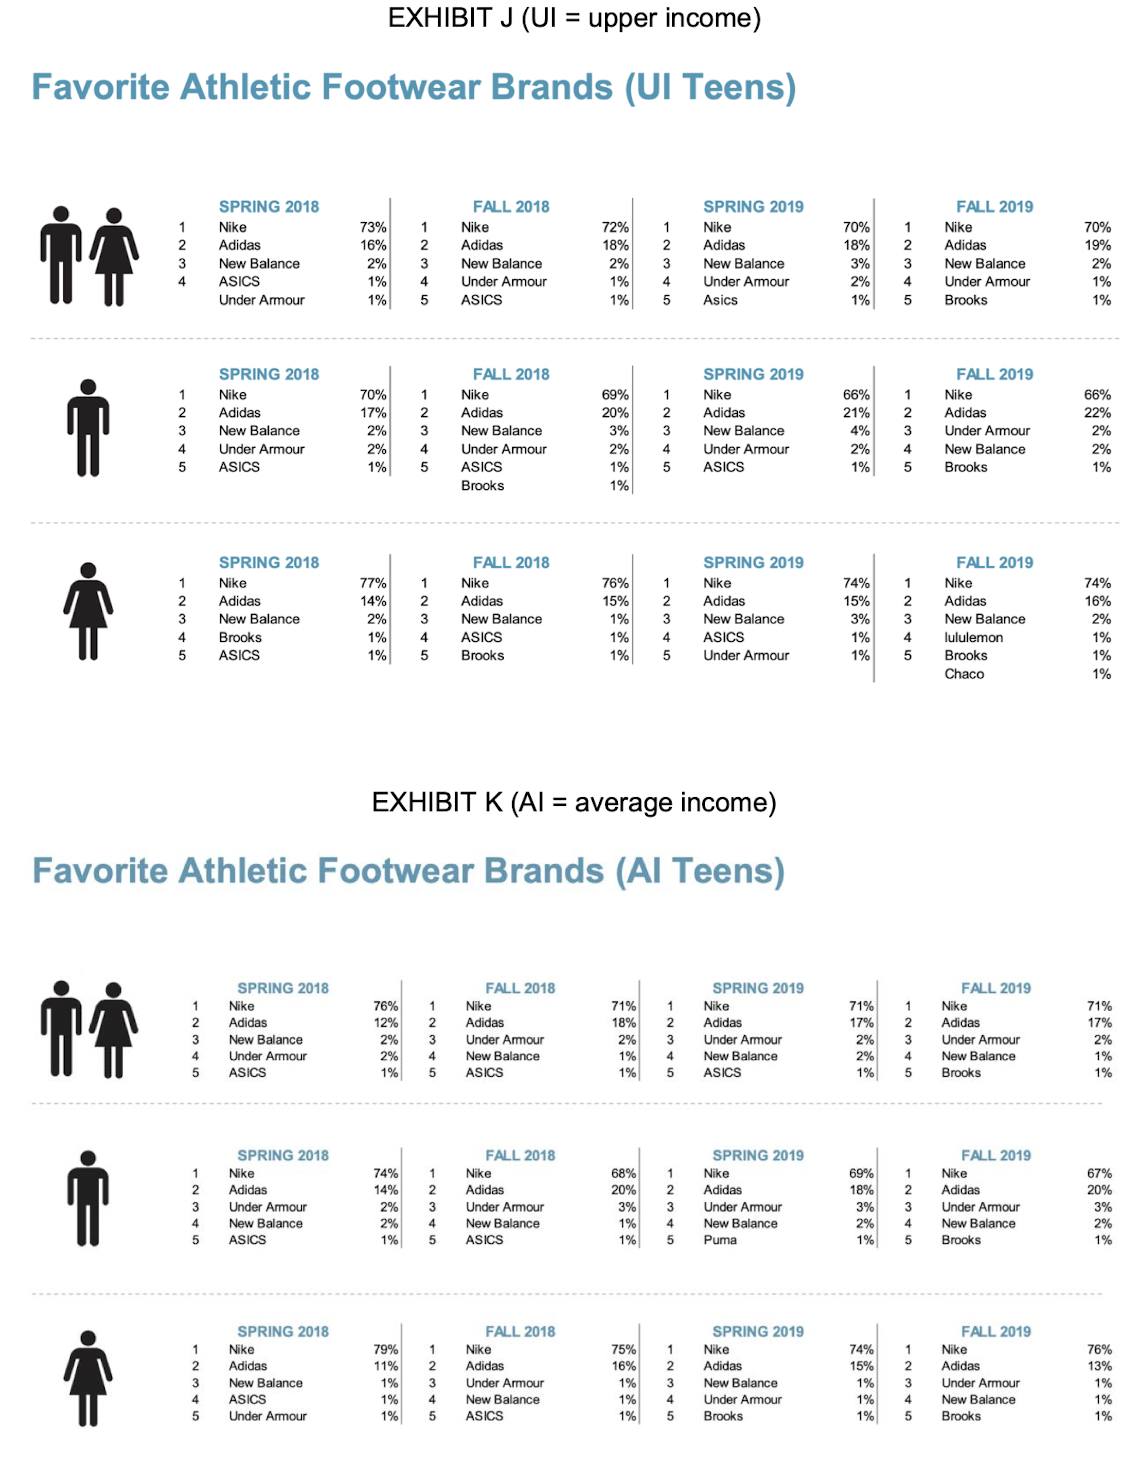
Assessment Assignment Type Proportion of Grade (1) Class Participation Individual 25% (2) Final Test Individual 25% (3) Group Assignments Group 35% (4) Final Presentation Group 15%Free Response Section (60 points) Pinterest (wwwpinterestcom i is a visual discovery platform where 322 million monthly active users around the world go to discover ideas that they can then bring from inspiration to reality. For example, if bride-to-be is planning a wedding, searching \"wedding ideas" on Pinterest will return images relating to wedding dresses, flowers, invitation designs, and other related products. Similarly, if male job applicant is looking for ideas on what to wear for a job interview, he can search on Pinterest for different combinations of suits, shirts, shoes, and accessories. Pins, which is the visual content returned in the search, are created by regular users, influencers, brands, and retailers. Users can save pins that they like to create a collection of pins, known as a board. Users can also follow others if they Iike those users' style and taste of products on their board. For its revenue model, Pinterest monetizes through digital advertising by charging a fee for: 1) Promoted pins: a paid pin that appears in a user's home feed or search results 2) Buyable pins: a pin where the products in the image are shoppable (i.e., products can be clicked on to reveal the product information). In 2019, Pinterest overtook Snapchat to become the third most popular platform, behind only Facebook and lnstagram. However, as shown in figure 1, Pinterest still lags behind Snapchat in terms of Generation 2 consumers (12 to 24 year olds). FIGURE 1. Pinterest and Snapchat User Penetration in the US, by Age, 2020 '36 of population in each group 0-11 3.0% 12717 1.2% 66.5% 81.3% 35-44 45-54 11.6% i 33.9% 55-64 6.1% i 26.1% 65+ 2.1% E I Snapchat users I Pinterest users Note interns: users who access the-fr Pinterest account we any o'emce at ieasr once per month; mobile phone users who access their Snapchat accounz via mobile app at least once per month Source. eMarkeier, November 2019 T108 :1 7 mm eMarketer torr Directions: Imagine that you are tasked with helping Pinterest increase the market share of generation Z consumers. Develop a detailed and actionable plan on how Pinterest can apply the tools of digital marketing to fulfill this objective. To help you get a better understanding of the shopping behaviors of gen 2 consumers, please refer to the findings of this Fall 2019 survey (N = 9,500; 54% male, 45% female) conducted by Piper Jaffray (see exhibits A-K). Assume that survey respondents are representative of all gen 2 consumers. Part i. (15 points) Who is yourtarget audience and why? (e.g., high school vs. college students; male vs. female; upper income vs. average income) Part ii. (15 points) What metrics would you use to define success in the marketing objective and why? (e.g., increasing user count, daily active use, number of followers, number of advertisers, click through rate) Part iii. (30 points) What is your strategy to increase the market share of gen Z consumers and why might it succeed (using evidence from the course and the exhibits below)? EXHIBIT A Project Framework & Key Demographics ALL TEENS Fall 2019 Spring 2019 F Fall 2018 Spring 2018 F Fall 2017 Spring 2017 Fall 2016 Spring 2016 Teens Surveyed 9,500 8,000 8.600 6,000 6,100 5,500 10.000 6,500 Gender - Female 45% 46% 44% 45% 46% 45% 45% 44% Gender - Male 54% 54% 56% 55% 54% 55% 55% 56% 15.8 16.3 16.4 16.4 16.0 Average Age 15.9 15.9 16.5 Percentage Of Teens Part-Time Employed 35% 38% 36% 40% 35% 39% 34% 39% Average Household Income $65,400 $67,700 $68,300 $66,296 $66, 100 $66, 100 $68,800 $62,500 UPPER-INCOME TEEN SURVEY Fall 2019 Spring 2019 Fall 2018 Spring 2018 Fall 2017 Spring 2017 Fall 2016 Spring 2016 Teens Surveyed - Upper Income 2,100 2,000 2,400 1,400 1,500 1,400 2,800 1,300 Gender - Female 43% 44% 42% 43% 43% 42% 41% 46% Gender - Male 56% 56% 58% 57% 57% 58% 59% 54% Average Age 15.8 16.2 16.0 16.4 15.9 16.4 15.8 16.5 Percentage Of Teens Part-Time Employed 36% 40% 38% 44% 38% 39% 31% 40% Average Household Income $102,700 $105,900 $101,900 $100,480 $101,000 $100,000 $109,000 $101,000 AVERAGE-INCOME TEEN SURVEY Fall 2019 Spring 2019 Fall 2018 Spring 2018 Fall 2017 Spring 2017 Fall 2016 Spring 2016 Teens Surveyed - Average Income 7,400 6,100 6,200 4,600 4.600 4,100 ,200 5,200 Gender - Female 45% 47% 45% 45% 47% 46% 46% 44% Gender - Male 53% 53% 55% 55% 53% 54% 54% 56% Average Age 15.8 16.3 15.9 16.4 15.9 16.4 16.0 164 Percentage Of Teens Part-Time Employed 35% 38% 35% 39% 35% 39% 30 %% 39% Average Household Income $54,500 $55,000 $55,800 $56,055 $55,000 $55,000 $53,000 $53,000 EXHIBIT B What Is in a Teen's Wallet Today? All Upper-Income Teens 20% Basic Needs Electronics, Cars, & Other 14% 23% Selfie Budget 36% 39% Clothing, Accessories, 46% Personal Care, Female Male & Shoes 49% 31% Social Budget 42% Food, Video Games, Music, Movies, Events, & BooksEXHIBIT C Teen Spending Breakdown By Income Demographic SPENDING BY CATEGORY (UPPER-INCOME, ALL TEENS) Fall 2016 Spring 2016 Fall 2019 Spring 2019 Fall 2018 Spring 2018 Fall 2017 Spring 2017 Spending by Category - All Teens 7% 7% Video Games / Systems 9% 8% 8% 8% 7% 8% 5% 5% Music / Movies (DVD/CD 4% 4% 4% 5% 5% 5% 7% 8% 7% 8% 8% 7% 7% 7% Electronics / Gadgets 20% 19% 21% 20% Clothing 21% 20% 21% 20% 9% 10% 9% 9% 9% 10% Accessories / Personal Care / Cosmetics 9%% 9% 8% 8% Shoes 9% 8% 8% 8% 8% 8% 24% 23% 22% Food 23% 23% 24% 24% 22% 5% 5% 5% 4% 5% 6% 6% 5% Concerts / Movies / Sporting Events 8% 9% 9% 9% 9% Car 6% 7% 6% 1% 1% 1% 1% 1% 1% 2% Books / Magazines 2% 2% 2% 2% 2% 1% Furniture / Room Accessories 2% 2% 4% 3% 3% 3% 4% 4% 4% 3% Other 39% 37% 38% 38% 38% 36% 38% 38% Total Fashion (Clothing, Access & Footwear) SPENDING BY CATEGORY (AVERAGE-INCOME, ALL TEENS) Fall 2019 Spring 2019 Fall 2018 Spring 2018 Fall 2017 Spring 2017 Fall 2016 Spring 2016 Spending by Category - All Teens Video games / systems 9% 9% 9% 9% 8% 8% 8% 8% 4% 5% 5% 5% 5% 6% Music / movies (DVD/CD) 4% 5% 7% 8% 8% 8% 8% 7% Electronics / gadgets 18% 20% 19% 20% 19% 20% 19% 20% Clothing 10% 11% 10% 11% 10% 10% 11% 11% Accessories/personal care/cosmetics 10% 9% 9% 10% 9% 10% 9% Shoes 10% 20% Food 19% 20% 20% 21% 20% 22% 21% 4% 4% 5% 4% 5% 4% 5% 5% Concerts/Movies/Sporting events 8% 8% 8% 10% 8% 9% 8% 9% Car 1% 1% 1% 2% 2% 2% Books/magazines 1% 2% 2% Furniture / room accessories 3% 2% 2% 2% 2% 2% 2% 3% 3% 4% 4% 4% 4% 3% Other 3% 40% 39% 40% 39% 40% 38% Total Fashion (Clothing, Access & Footwear) 40% 39% EXHIBIT D Teen Spending Breakdown By Gender SPENDING BY CATEGORY (UPPER-INCOME MALES) Fall 2016 Spring 2016 Spending by Category - Male Fall 2019 Spring 2019 Fall 2018 Spring 2018 Fall 2017 Spring 2017 11% 13% 13% 14% 14% 13% 11% 12% Video Games / Systems 4% 5% 4% 5% 5% 5% 5% 6% Music / Movies (DVD/CD) 9% 9% 8% 9% 9% 10% 10% Electronics / gadgets 9% 15% 17% 16% 17% 16% 17% 16% 17% Clothing 5% 4% 5% 5% 5% 4% 4% 5% Accessories / personal care / cosmetics 9% 9% 9% 8% 9% 8% Shoes 10% 9% 23% 22% 24% 23% 23% 24% 24% 25% Food 5% 5% 5% 5% 4% 5% 5% 6% Concerts/Movies/Sporting Events 10% 8% 9% 8% 11% 10% 10% 7% Car 1% 2% Books / magazines 1% 1% 1% 1% 1% 1% 2% 2% 2% 1% 2% 1% 2% 1% Furniture / room accessories 5% 5% 4% 4% 4% 5% 5% 4% Other 30% 31% 28% 29% 28% Total Fashion (Clothing, Access & Footwear) 31% 29% 31% SPENDING BY CATEGORY (UPPER-INCOME FEMALES) Spring 2018 Fall 2017 Spring 2017 Fall 2016 Spring 2016 Spending by Category - Female Fall 2019 Spring 2019 Fall 2018 1% 1% Video Games / Systems 2% 1% 1% 1% 1% 1% 5% Music / Movies (DVD/CD) 4% 4% 5% 5% 5% 5% 5% 5% 5% 5% 5% 5% Electronics / gadgets 6% 5% 6% 27% 25% 26% 25% 24% 25% 27% 26% Clothing 17% 17% Accessories / personal care / cosmetics 15% 16% 16% 17% 16% 16% 7% 7% 7% 7% 7% 8% Shoes 8% 7% 23% 22% 22% Food 23% 24% 23% 25% 22% 6% 5% 5% 5% 6% 6% 6% 5% Concerts/Movies/Sporting Events 4% 7% 6% 7% 7% 7% 5% 7% Car 2% 2% 1% 2% 2% 2% 2% Books / magazines 2% 3% 2% 2% 2% 2% 2% 2% 1% Fumiture / room accessories 2% 2% 2% 2% 2% Other 2% 2% 3% 49% 48% 48% 49% 47% 48% 51% 51% Total Fashion (Clothing, Access & Footwear)EXHIBIT E Teen Shopping Channel Preference ALL TEENS Fall 2019 Spring 2019 Fall 2018 Spring 2018 Fall 2017 Spring 2017 Fall 2016 Spring 2016 Specialty 23% 24% 24% 25% 23% 24% 26% 27% Major Chain / Dept Store 13% 13% 15% 13% 15% 16% 17% 17% Off-Price 11% 11% 11% 11% 12% 11% 11% 11% Discount 12% 12% 12% 13% 13% 12% 12% 13% Outlet 16% 14% 15% 14% 15% 14% 15% 12% Mail order 2% 2% 5% 7% 6% 6% 6% 6% Online Only eTailers 23% 24% 18% 19% 17% 17% 15% 14% ALL FEMALES Fall 2019 Spring 2019 Fall 2018 Spring 2018 Fall 2017 Spring 2017 Fall 2016 Spring 2016 Specialty 31% 32% 30% 30% 29% 31% 33% 31% Major Chain / Dept Store 11% 12% 13% 12% 13% 14% 15% 15% Off-Price 13% 13% 14% 14% 15% 13% 12% 14% Discount 14% 14% 14% 16% 15% 15% 13% 14% Outlet 15% 12% 12% 11% 12% 12% 11% 11% Mail order 1% 1% 5% 6% 5% 6% 6% 6% Online Only eTailers 15% 16% 12% 12% 10% 11% 9% 9% ALL MALES Fall 2019 Spring 2019 Fall 2018 Spring 2018 Fall 2017 Spring 2017 Fall 2016 Spring 2016 Specialty 17% 18% 20% 21% 18% 20% 20% 23% Major Chain / Dept Store 14% 14% 16% 14% 16% 18% 18% 19% Off-Price 10% 9% 9% 8% 10% 9% 10% 9% Discount 11% 11% 10% 10% 11% 10% 11% 12% Outlet 17% 16% 17% 16% 17% 16% 17% 14% Mail order 2% 2% 6% 7% 6% 6% 5% 6% Online Only eTailers 29% 30% 23% 24% 22% 22% 19% 18%EXHIBIT F Favorite Clothing Brands (All Teens) SPRING 2018 FALL 2018 SPRING 2019 FALL 2019 1 33% 1 Nike 34% 1 Nike 36% Nike 33% 1 Nike 2 Adidas 8% 2 Adidas 10% Adidas 9% 2 Adidas 10% 3 American Eagle 6% 3 American Eagle 5% American Eagle 5% 3 American Eagle 5% 4 Ralph Lauren 4% 4 Ralph Lauren 4% Hollister 3% 4 Hollister 4% 5 Supreme 4% 5 Hollister 3% 5 Ralph Lauren 3% 5 Vans 3% 6 Hollister 2% 6 PacSun 3% 6 Vans 3% 6 Ralph Lauren 3% 7 PacSun 2% 7 Under Armour 3% 7 Gucc 3% 7 Champion 3% 8 Under Armour 2% 8 Vans 3% 8 H&M 2% 8 Under Armour 3% 9 H&M 2% 9 Supreme 2% PacSun 2% 9 PacSun 10 Gucci 2% 10 H&M 2% 10 Supreme 2% 10 Gucci 2% SPRING 2018 FALL 2018 SPRING 2019 FALL 2019 1 American Eagle 16% American Eagle 14% American Eagle 13% American Eagle 15% Nike 11% Forever 21 10% 2 Nike 10% Nike 11% Forever 21 11% Nik 10% 3 Forever 2 9% DAWN- Forever 21 7% UIAWN UAWN- Victoria's Secret 6% PacSun 5% Urban Outfitters 5% PacSun 5% Urban Outfitters 4% Hollister 5% Victoria's Secret 5% Hollister 5% 6 H&M 3% 6 Urban Outfitters 4% PacSur 4% lululemon 5% PacSun 3% 7 Victoria's Secret 4% lululemon 4% 7 Victoria's Secret 3% rue 21 3% 8 lululemon 3% Hollister 4% H&M 8 3% 9 lululemon 2% H&M 3% H&M 2% 9 Urban Outfitters 3% 10 Hollister 2% 2% 10 rue 21 2% 10 rue 2 10 rue 21 EXHIBIT G Favorite Footwear Brands (All Teens) SPRING 2018 FALL 2018 SPRING 2019 FALL 2019 1 Nike 56% 1 Nike 50% Nike 51% Nike 50% 2 Adidas 15% 2 Adidas 19% UN - Adidas 17% Adidas 19% 3 Vans 10% Vans 13% Vans 13% Vans 12% 4 Foot Locker 2% 4 Foot Locker 3% 4 Foot Locker 3% 4 Foot Locker 3% 5 Converse 2% Converse 2% 5 Converse 2% 5 New Balance 1% 6 6 New Balance 1% New Balance 1% 6 New Balance 2% Under Armour 1% 7 Sperry Top-Sider 1% 7 Sperry Top-Sider 1% 7 Under Armour 1% 7 Converse 1% 8 Under Armour 1% 8 Under Armour 1% 8 Sperry Top-Sider 1% 8 Champs Sports 1% a Finish Line 1% Finish Line 1% 9 Finish Line 1% Crocs 1% 10 Ariat 1% 10 Champs Sports 1% 10 Champs Sports 1% 10 Finish Line 1% SPRING 2018 FALL 2018 SPRING 2019 FALL 2019 1 Nike 35% 1 Nike 30% Nike 30% 1 Nike 33% Vans 18% 2 Vans 26% Vans 28% 2 Vans 30% Converse 10% Adidas 9% Adidas 9% 3 Adidas 7% Adidas 9% 4 Converse 8% Converse 8% 4 Converse 6% Steve Madden 3% Birkenstock 4% Steve Madden 2% 5 Birkenstock 4% DSW 2% 6 Steve Madden 2% Foot Locker 2% 6 Foot Locker 2% Journeys 2% Foot Locker 2% 7 Birkenstock 2% 7 Steve Madden 2% Birkenstock 2% 8 SV 2% 8 DSW 2% 8 Crocs 1% Foot Locker 1% Journeys 2% Journeys 1% DSW 1% 0 Payless ShoeSource 1% 10 Payless ShoeSource 1% 10 Payless ShoeSource 1% 10 Journeys 1%EXHIBIT H (UI = upper income) Favorite Athletic Clothing Brands (UI Teens) SPRING 2018 FALL 2018 SPRING 2019 FALL 2019 59% 61% Nike 60% Nike 57% 1 Nike Nike 12% Adidas 13% lululemon 15% 2 lululemon 13% Adidas 12% 11% 12% nAWN - Adidas Adidas OnAWN - lululemon 11% lululemon 4 5% Under Armour 5% Under Armour 6% Under Armour 6% Under Armour 1% Champion 1% 1% Patagonia 1% Athleta Patagonia FALL 2018 SPRING 2019 FALL 2019 SPRING 2018 Nike 66% Nike 57% Nike 64% Nike 62% 1 14% Adidas 13% 2 Adidas 16% Adida 14% 2 Adidas 9% 3 Under Armour 8% CA WN - Under Armour 7% 3 Under Armour 7% Under Armour MA WN 4% 4 lululemon 3% lululemon 3% 4 lululemon 4 lululemon 3% 6 The North Face Patagonia The North Face 1% 2% 1% Patagonia FALL 2018 SPRING 2019 FALL 2019 SPRING 2018 Nike 54% Nike 50% Nike 51% Nike 4% lululemon 24% lululemon 29% 28% 21% 2 2 lululemon lululemon AWN - 8% 3 Adidas 10% CA WN - Adidas 11% 3 Adidas 10% Adidas Under Armour 3% 4 Under Armour 3% Athleta 2% 4 Under Armour 3% Athleta 1%% 1% Under Armour 2%% Athleta 2% Patagonia Victoria's Secret 1% EXHIBIT I (Al = average income) Favorite Athletic Clothing Brands (Al Teens) SPRING 2018 FALL 2018 SPRING 2019 FALL 2019 63% Nike 68% 1 Nike 65% Nike 63% 1 Nike Adidas 13% Adidas 14% Adidas 12% 2 Adidas 15% 2 7% 3 Under Armour 7% 3 7% Under Armour Under Armour 7% Under Armour CA WN - 5% 4 5% lululemon 3% 4 lululemon 4%% 4 lululemon lululemon 1% 1% The North Face 10% The North Face 1% The North Face Patagonia FALL 2019 SPRING 2018 FALL 2018 SPRING 2019 Nike 64% Nike 62% Nike 57% 1 Nike 64% 17% Adidas 15% 2 Adidas 17% Adidas 13% Adidas 9% AWN 9% 3 Under Armour CA WN - Under Armour 8% Under Armour 9% 3 Under Armour lululemon 1% Patagonia 1% lululemon 1% lululemon 2% 4 The North Face 1% The North Face 19% lululemon The North Face FALL 2018 FALL 2019 SPRING 2018 SPRING 2019 Nike 62% Nike 64% Nike 59% Nike 13% 2 Adidas 12% Adidas 11% Adida 11% Adidas 7% 3 lululemon 10% HAWN - lululemon lululemon 10% 6% CA WN - CA WN - lululemon Under Armour 5% Under Armour 5% Under Armour 5% Under Armour 5% 1% 1% 1% 1% Fabletics Fabletics Victoria's Secret The North Face Victoria's Secret 1%EXHIBIT J (UI = upper income) Favorite Athletic Footwear Brands (UI Teens) SPRING 2018 FALL 2018 SPRING 2019 FALL 2019 72% 1 Nike 70% Nike 70% Nike 73% 1 Nike 19% Adidas 16% 2 Adidas 18% 2 Adidas 18% Adidas New Balance 2% New Balance New Balance AWN - 2% 3 3 3% U A WN - 2% New Balance 1% 1% 4 Under Armour 1% 4 Under Armour 2% Under Armour ASICS Under Armour 1% 5 1%% ASIC 1% Asic 1% Brooks FALL 2019 SPRING 2018 FALL 2018 SPRING 2019 Nike 66% Nike Nike 69% Nike 66% 70% Adidas 17% 2 Adidas 20% 2 Adidas 21% Adidas 22% 2% New Balance 2% 3 New Balance 3% 3 New Balance 4% A WN - Under Armour CA WN - 2% 4 Under Armour 2% 4 Under Armour 2% New Balance 2% Under Armour 1% ASICS 1% ASICS 1% ASICS 1% Brooks Brooks 1% SPRING 2018 FALL 2018 SPRING 2019 FALL 2019 74% Nike Nike 76% 74% Nike 77% 1 Nike 16% Adidas 14% 2 Adidas 15% 2 Adidas 15% Adidas New Balance 2% 3 New Balance 1% 3 New Balance 3% A WN - New Balance CA WN - 1% Brooks 1% 4 ASICS 1% 4 ASICS 1% lululemon Under Armour 10% Brooks 1% ASICS 10% Brooks 10% Chaco 1% EXHIBIT K (AI = average income) Favorite Athletic Footwear Brands (Al Teens) FALL 2019 SPRING 2018 FALL 2018 SPRING 2019 76% 71% Nike 71% 1 Nike 71% Nike Nike 1 18% 17% Adidas 17% Adidas 12% Adidas Adidas C N Under Armour 2% 3 Under Armour 2% Under Armour 2% New Balance 2% JAWN - 1% A New Balance 1% 2% New Balance A New Balance 2% 1% CI A W Under Armour 1% ASICS 1% Brooks ASICS ASICS 1% FALL 2018 FALL 2019 SPRING 2018 SPRING 2019 74% Nike 68% Nike 69% Nike 67% Nike 20% 2 Adidas 18% 2 Adidas 20% Adidas 14% Adidas 3% Under Armour 2% Under Armour 3% Under Armour 3% Under Armour New Balance 2% New Balance 2% CA WN - 2% In A W New Balance 1% New Balance 19% 10% ASICS ASICS 10% Puma Brooks SPRING 2018 FALL 2018 SPRING 2019 FALL 2019 Nike 75% Nike 74% Nike 76% Nike 79% 16% 15% Adidas 13% Adidas 11% Adidas Adidas New Balance 1% Under Armour 1% New Balance 1% Under Armour 1% On A WN - CA WN - CA WN - 1% CI A W N - ASICS 1% New Balance 1% Under Armour 1% New Balance 1% ASICS Brooks Brooks 10% Under Armour
Step by Step Solution
There are 3 Steps involved in it
Step: 1
Get Instant Access to Expert-Tailored Solutions
See step-by-step solutions with expert insights and AI powered tools for academic success
Step: 2
Step: 3
Ace Your Homework with AI
Get the answers you need in no time with our AI-driven, step-by-step assistance