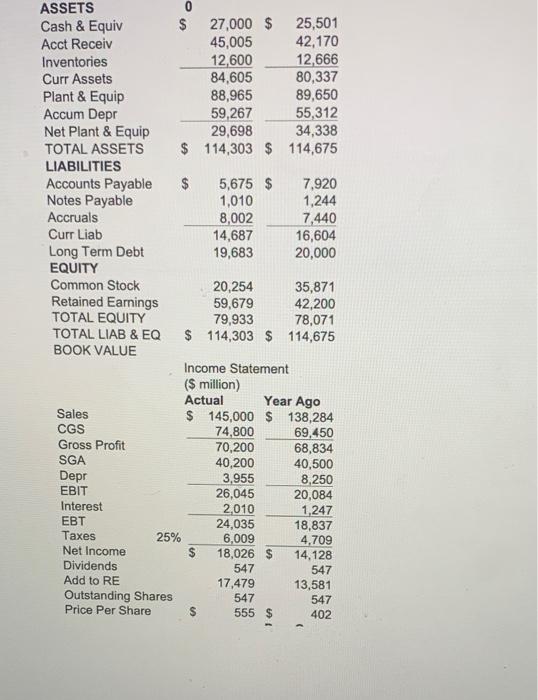
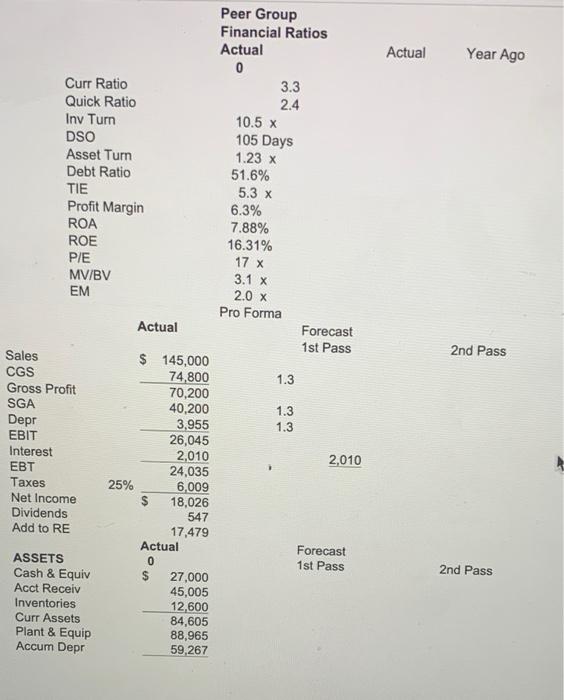
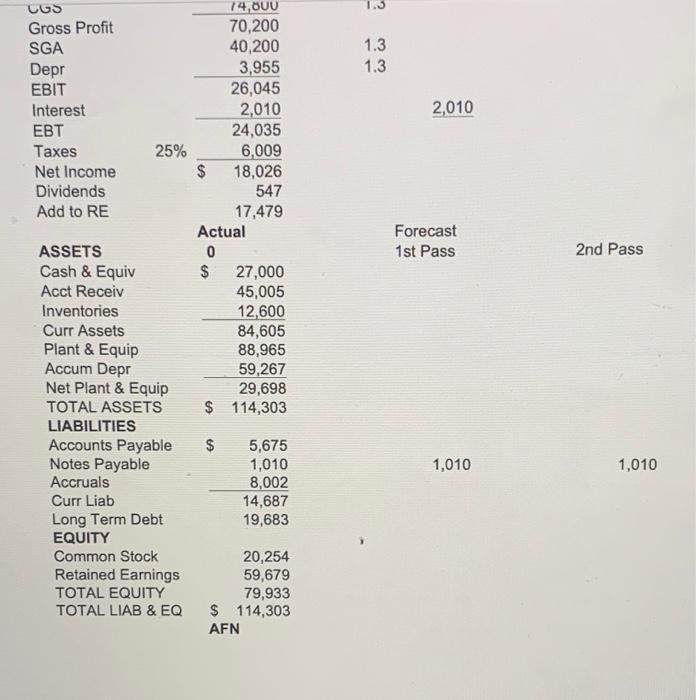
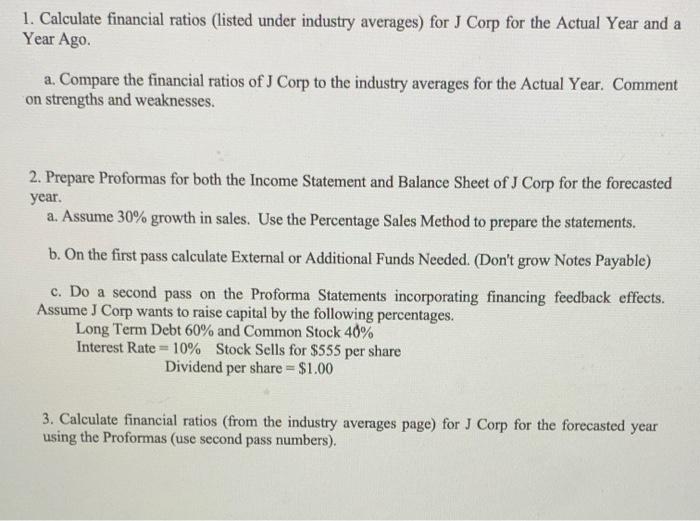
ASSETS 0 Cash & Equiv $ 27,000 $ 25,501 Acct Receiv 45,005 42,170 Inventories 12,600 12,666 Curr Assets 84,605 80,337 Plant & Equip 88,965 89,650 Accum Depr 59,267 55,312 Net Plant & Equip 29,698 34,338 TOTAL ASSETS $ 114,303 $ 114,675 LIABILITIES Accounts Payable $ 5,675 $ 7,920 Notes Payable 1,010 1,244 Accruals 8,002 7,440 Curr Liab 14,687 16,604 Long Term Debt 19,683 20,000 EQUITY Common Stock 20,254 35,871 Retained Earnings 59,679 42,200 TOTAL EQUITY 79,933 78,071 TOTAL LIAB & EQ $ 114,303 $ 114,675 BOOK VALUE Income Statement ($ million) Actual Year Ago Sales $ 145,000 $ 138,284 CGS 74,800 69,450 Gross Profit 70,200 68,834 SGA 40,200 40,500 Depr 3,955 8,250 EBIT 26.045 20,084 Interest 2,010 1,247 EBT 24,035 18,837 Taxes 25% 6,009 4,709 Net Income 18,026 $ 14,128 Dividends 547 547 Add to RE 17,479 13,581 Outstanding Shares 547 547 Price Per Share $ 555 $ 402 Actual Year Ago Peer Group Financial Ratios Actual 0 Curr Ratio 3.3 Quick Ratio 2.4 Inv Turn 10.5 x DSO 105 Days Asset Turn 1.23 x Debt Ratio 51.6% TIE 5.3 x Profit Margin 6.3% ROA 7.88% ROE 16.31% PIE 17 x MV/BV 3.1 x EM 2.0 x Pro Forma Actual Forecast 1st Pass Sales $ 145,000 CGS 74,800 1.3 Gross Profit 70,200 SGA 40,200 1.3 Depr 3,955 1.3 EBIT 26,045 Interest 2,010 2010 EBT 24,035 Taxes 25% 6,009 Net Income $ 18,026 Dividends 547 Add to RE 17,479 Actual Forecast ASSETS 0 1st Pass Cash & Equiv $ 27,000 Acct Receiv 45,005 Inventories 12,600 Curr Assets 84,605 Plant & Equip 88,965 Accum Depr 59,267 2nd Pass 2nd Pass 1.3 1.3 2,010 Forecast 1st Pass 2nd Pass UGS 74,000 Gross Profit 70,200 SGA 40,200 Depr 3,955 EBIT 26,045 Interest 2,010 24,035 Taxes 25% 6,009 Net Income $ 18,026 Dividends 547 Add to RE 17,479 Actual ASSETS 0 Cash & Equiv $ 27,000 Acct Receiv 45,005 Inventories 12,600 Curr Assets 84,605 Plant & Equip 88,965 Accum Depr 59,267 Net Plant & Equip 29,698 TOTAL ASSETS $ 114,303 LIABILITIES Accounts Payable $ 5,675 Notes Payable 1,010 Accruals 8,002 Curr Liab 14,687 Long Term Debt 19,683 EQUITY Common Stock 20,254 Retained Earnings 59,679 TOTAL EQUITY 79,933 TOTAL LIAB & EQ $ 114,303 AFN 1,010 1,010 1. Calculate financial ratios (listed under industry averages) for J Corp for the Actual Year and a Year Ago. a. Compare the financial ratios of J Corp to the industry averages for the Actual Year. Comment on strengths and weaknesses. 2. Prepare Proformas for both the Income Statement and Balance Sheet of J Corp for the forecasted year. a. Assume 30% growth in sales. Use the Percentage Sales Method to prepare the statements. b. On the first pass calculate External or Additional Funds Needed. (Don't grow Notes Payable) c. Do a second pass on the Proforma Statements incorporating financing feedback effects. Assume J Corp wants to raise capital by the following percentages. Long Term Debt 60% and Common Stock 40% Interest Rate = 10% Stock Sells for $555 per share Dividend per share = $1.00 3. Calculate financial ratios (from the industry averages page) for J Corp for the forecasted year using the Proformas (use second pass numbers)


