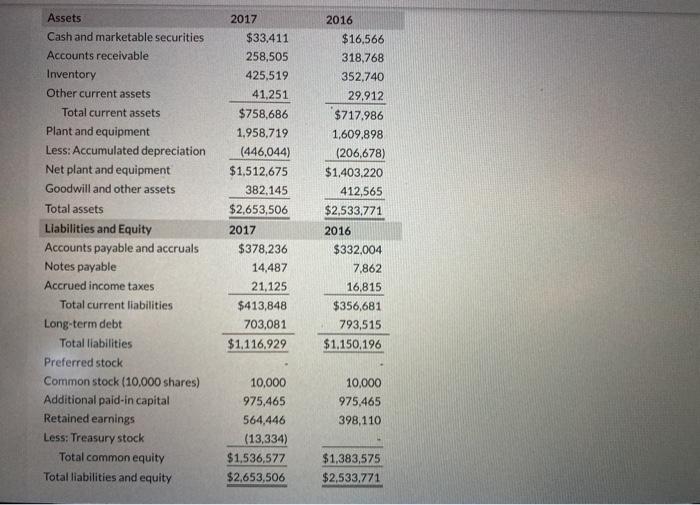
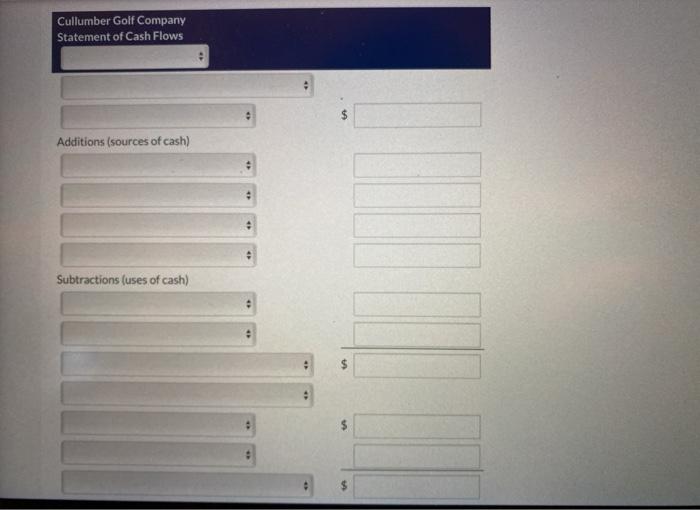
Assets Cash and marketable securities Accounts receivable Inventory Other current assets Total current assets Plant and equipment Less: Accumulated depreciation Net plant and equipment Goodwill and other assets Total assets Liabilities and Equity Accounts payable and accruals Notes payable Accrued income taxes Total current liabilities Long-term debt Total liabilities Preferred stock Common stock (10,000 shares) Additional paid-in capital Retained earnings Less: Treasury stock Total common equity Total liabilities and equity 2017 $33,411 258,505 425,519 41.251 $758,686 1,958,719 (446,044) $1,512,675 382.145 $2,653,506 2017 $378,236 14,487 21,125 $413,848 703,081 $1,116,929 2016 $16,566 318,768 352.740 29,912 $717.986 1,609,898 (206,678) $1,403,220 412,565 $2,533,771 2016 $332,004 7,862 16,815 $356,681 793,515 $1,150.196 10,000 975,465 398,110 10,000 975,465 564,446 (13,334) $1.536,577 $2,653,506 $1,383,575 $2,533,771 In addition, it was reported that the company had a net income of $3,529,848 and that depreciation expenses were equal to $239,366 during 2017. Assume amortization expense was $0 in 2017. Construct a 2017 cash flow statement for this firm. (If an amount reduces the cash flow then enter with negative sign preceding the number e.g. -45 or parentheses e.g. (45).) Cullumber Golf Company Statement of Cash Flows $ Additions (sources of cash) Subtractions (uses of cash) $ $ $ Assets Cash and marketable securities Accounts receivable Inventory Other current assets Total current assets Plant and equipment Less: Accumulated depreciation Net plant and equipment Goodwill and other assets Total assets Liabilities and Equity Accounts payable and accruals Notes payable Accrued income taxes Total current liabilities Long-term debt Total liabilities Preferred stock Common stock (10,000 shares) Additional paid-in capital Retained earnings Less: Treasury stock Total common equity Total liabilities and equity 2017 $33,411 258,505 425,519 41.251 $758,686 1,958,719 (446,044) $1,512,675 382.145 $2,653,506 2017 $378,236 14,487 21,125 $413,848 703,081 $1,116,929 2016 $16,566 318,768 352.740 29,912 $717.986 1,609,898 (206,678) $1,403,220 412,565 $2,533,771 2016 $332,004 7,862 16,815 $356,681 793,515 $1,150.196 10,000 975,465 398,110 10,000 975,465 564,446 (13,334) $1.536,577 $2,653,506 $1,383,575 $2,533,771 In addition, it was reported that the company had a net income of $3,529,848 and that depreciation expenses were equal to $239,366 during 2017. Assume amortization expense was $0 in 2017. Construct a 2017 cash flow statement for this firm. (If an amount reduces the cash flow then enter with negative sign preceding the number e.g. -45 or parentheses e.g. (45).) Cullumber Golf Company Statement of Cash Flows $ Additions (sources of cash) Subtractions (uses of cash) $ $ $


