ASSIGNED COMPANY: GENUINE PARTS CO

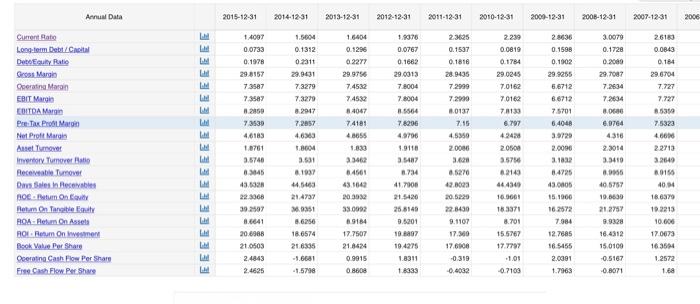
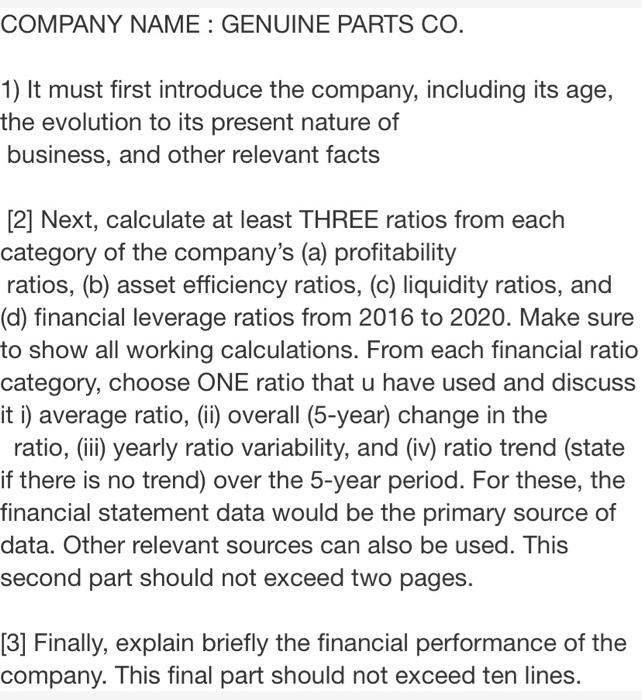
Annual Data 2015-12-31 2014-12-31 2013-12-31 2012-12-31 2011-12-31 2010-12-31 2009-12-31 2008-12-31 2007-12-31 2006 14097 0.0733 EEEEE 0.1978 29.8157 7.3587 73587 2.2859 73539 Current Ratio Long-term Debit/C Debiuty Ratio Gross Margi Seerata Masai EBIT Martin EDITDA Margin PreTax Pro Mato Net Proft Marin Ant Tume in Tumorete Receita Tumowe Das since Boertum Oy Retum On Tanely BOX-Return On Assets ROL Resum One Rook Value Per Share Operating Cash Flow Per Share Free Cash Flow Per Share 1.560 0.1312 0.2311 22.0431 7.3279 7.3279 8. 2017 72057 4,633 8604 3.531 8.1997 LM 1.6404 0.1296 02277 29.9756 7.4532 7.4532 84047 74181 4.8655 1.830 33462 6.4661 43.1642 20.3032 33.0092 9164 17.7507 21.3424 0.9915 08600 23125 0.1537 0.1818 28.9435 72999 7.2000 1.0137 7.15 4,5350 20006 3.600 0.0767 0.1662 29.0013 7.8004 7.8004 3.5564 78206 45796 1.9118 3.5487 8.734 417000 21.5420 25.8145 3.5201 1997 194275 18311 1.8333 1.8761 3.5740 0.045 43.6928 22.3368 39.2507 8.6641 20.6988 21.0503 24843 2.4625 2.239 0.0819 0.1784 29.0245 7.0162 7.0162 7.8130 6.797 4241 20600 3.5755 2149 444300 16.5661 18.3371 8.701 15.5767 17.7797 -101 -0.7103 2.8636 0.1598 0.1002 29.9255 5.6712 8.6712 7.5701 6.4048 3.9720 2.0096 3.1822 8.4725 49.0005 15.1900 162572 7.984 127605 16.5455 2.0991 1.7963 3.0079 0.1728 0.2000 29.7087 72634 7.2634 8.000 8.0764 4318 2.2014 3.3410 8.9656 405757 19.0630 212757 9.9328 18.4512 15.0100 -0.5167 -0.8071 26183 0.0843 0.184 29.6704 7.727 7.727 85350 7.5323 4.600 22713 3.2649 8.0156 40.94 18.6379 19.2213 10.606 17.0673 163691 1.2572 1.68 EEEEEEE 214738 20.9351 8.6256 18.6574 21.8305 - 1.6681 -1.5798 42.000 20.5220 22 3430 9.1107 17.30 17.68 -0,319 -0.4032 COMPANY NAME: GENUINE PARTS CO. 1) It must first introduce the company, including its age, the evolution to its present nature of business, and other relevant facts [2] Next, calculate at least THREE ratios from each category of the company's (a) profitability ratios, (b) asset efficiency ratios, (c) liquidity ratios, and (d) financial leverage ratios from 2016 to 2020. Make sure to show all working calculations. From each financial ratio category, choose ONE ratio that u have used and discuss it i) average ratio, (ii) overall (5-year) change in the ratio, (iii) yearly ratio variability, and (iv) ratio trend (state if there is no trend) over the 5-year period. For these, the financial statement data would be the primary source of data. Other relevant sources can also be used. This second part should not exceed two pages. [3] Finally, explain briefly the financial performance of the company. This final part should not exceed ten lines. Annual Data 2015-12-31 2014-12-31 2013-12-31 2012-12-31 2011-12-31 2010-12-31 2009-12-31 2008-12-31 2007-12-31 2006 14097 0.0733 EEEEE 0.1978 29.8157 7.3587 73587 2.2859 73539 Current Ratio Long-term Debit/C Debiuty Ratio Gross Margi Seerata Masai EBIT Martin EDITDA Margin PreTax Pro Mato Net Proft Marin Ant Tume in Tumorete Receita Tumowe Das since Boertum Oy Retum On Tanely BOX-Return On Assets ROL Resum One Rook Value Per Share Operating Cash Flow Per Share Free Cash Flow Per Share 1.560 0.1312 0.2311 22.0431 7.3279 7.3279 8. 2017 72057 4,633 8604 3.531 8.1997 LM 1.6404 0.1296 02277 29.9756 7.4532 7.4532 84047 74181 4.8655 1.830 33462 6.4661 43.1642 20.3032 33.0092 9164 17.7507 21.3424 0.9915 08600 23125 0.1537 0.1818 28.9435 72999 7.2000 1.0137 7.15 4,5350 20006 3.600 0.0767 0.1662 29.0013 7.8004 7.8004 3.5564 78206 45796 1.9118 3.5487 8.734 417000 21.5420 25.8145 3.5201 1997 194275 18311 1.8333 1.8761 3.5740 0.045 43.6928 22.3368 39.2507 8.6641 20.6988 21.0503 24843 2.4625 2.239 0.0819 0.1784 29.0245 7.0162 7.0162 7.8130 6.797 4241 20600 3.5755 2149 444300 16.5661 18.3371 8.701 15.5767 17.7797 -101 -0.7103 2.8636 0.1598 0.1002 29.9255 5.6712 8.6712 7.5701 6.4048 3.9720 2.0096 3.1822 8.4725 49.0005 15.1900 162572 7.984 127605 16.5455 2.0991 1.7963 3.0079 0.1728 0.2000 29.7087 72634 7.2634 8.000 8.0764 4318 2.2014 3.3410 8.9656 405757 19.0630 212757 9.9328 18.4512 15.0100 -0.5167 -0.8071 26183 0.0843 0.184 29.6704 7.727 7.727 85350 7.5323 4.600 22713 3.2649 8.0156 40.94 18.6379 19.2213 10.606 17.0673 163691 1.2572 1.68 EEEEEEE 214738 20.9351 8.6256 18.6574 21.8305 - 1.6681 -1.5798 42.000 20.5220 22 3430 9.1107 17.30 17.68 -0,319 -0.4032 COMPANY NAME: GENUINE PARTS CO. 1) It must first introduce the company, including its age, the evolution to its present nature of business, and other relevant facts [2] Next, calculate at least THREE ratios from each category of the company's (a) profitability ratios, (b) asset efficiency ratios, (c) liquidity ratios, and (d) financial leverage ratios from 2016 to 2020. Make sure to show all working calculations. From each financial ratio category, choose ONE ratio that u have used and discuss it i) average ratio, (ii) overall (5-year) change in the ratio, (iii) yearly ratio variability, and (iv) ratio trend (state if there is no trend) over the 5-year period. For these, the financial statement data would be the primary source of data. Other relevant sources can also be used. This second part should not exceed two pages. [3] Finally, explain briefly the financial performance of the company. This final part should not exceed ten lines


