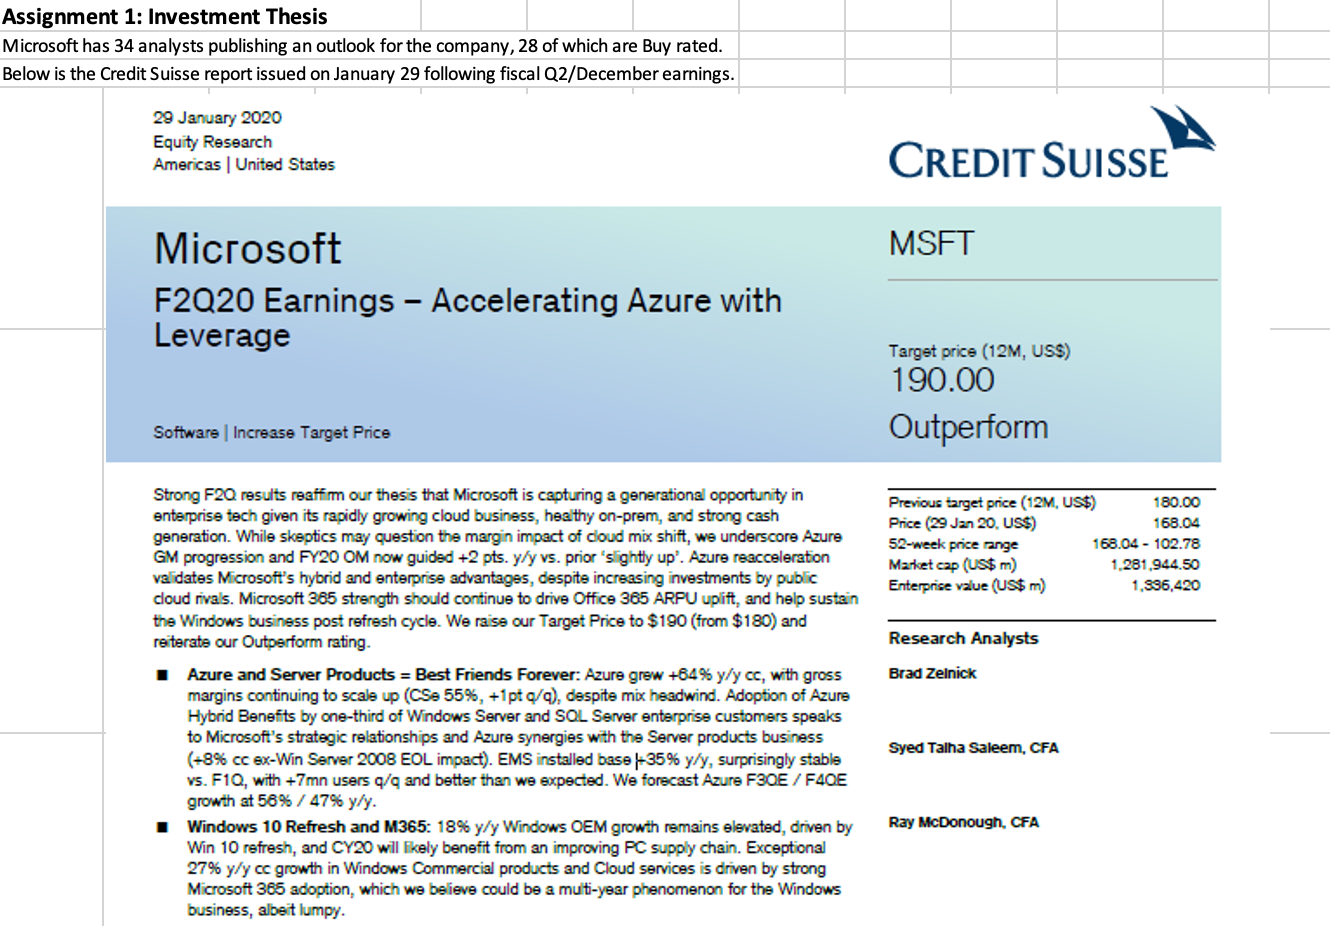
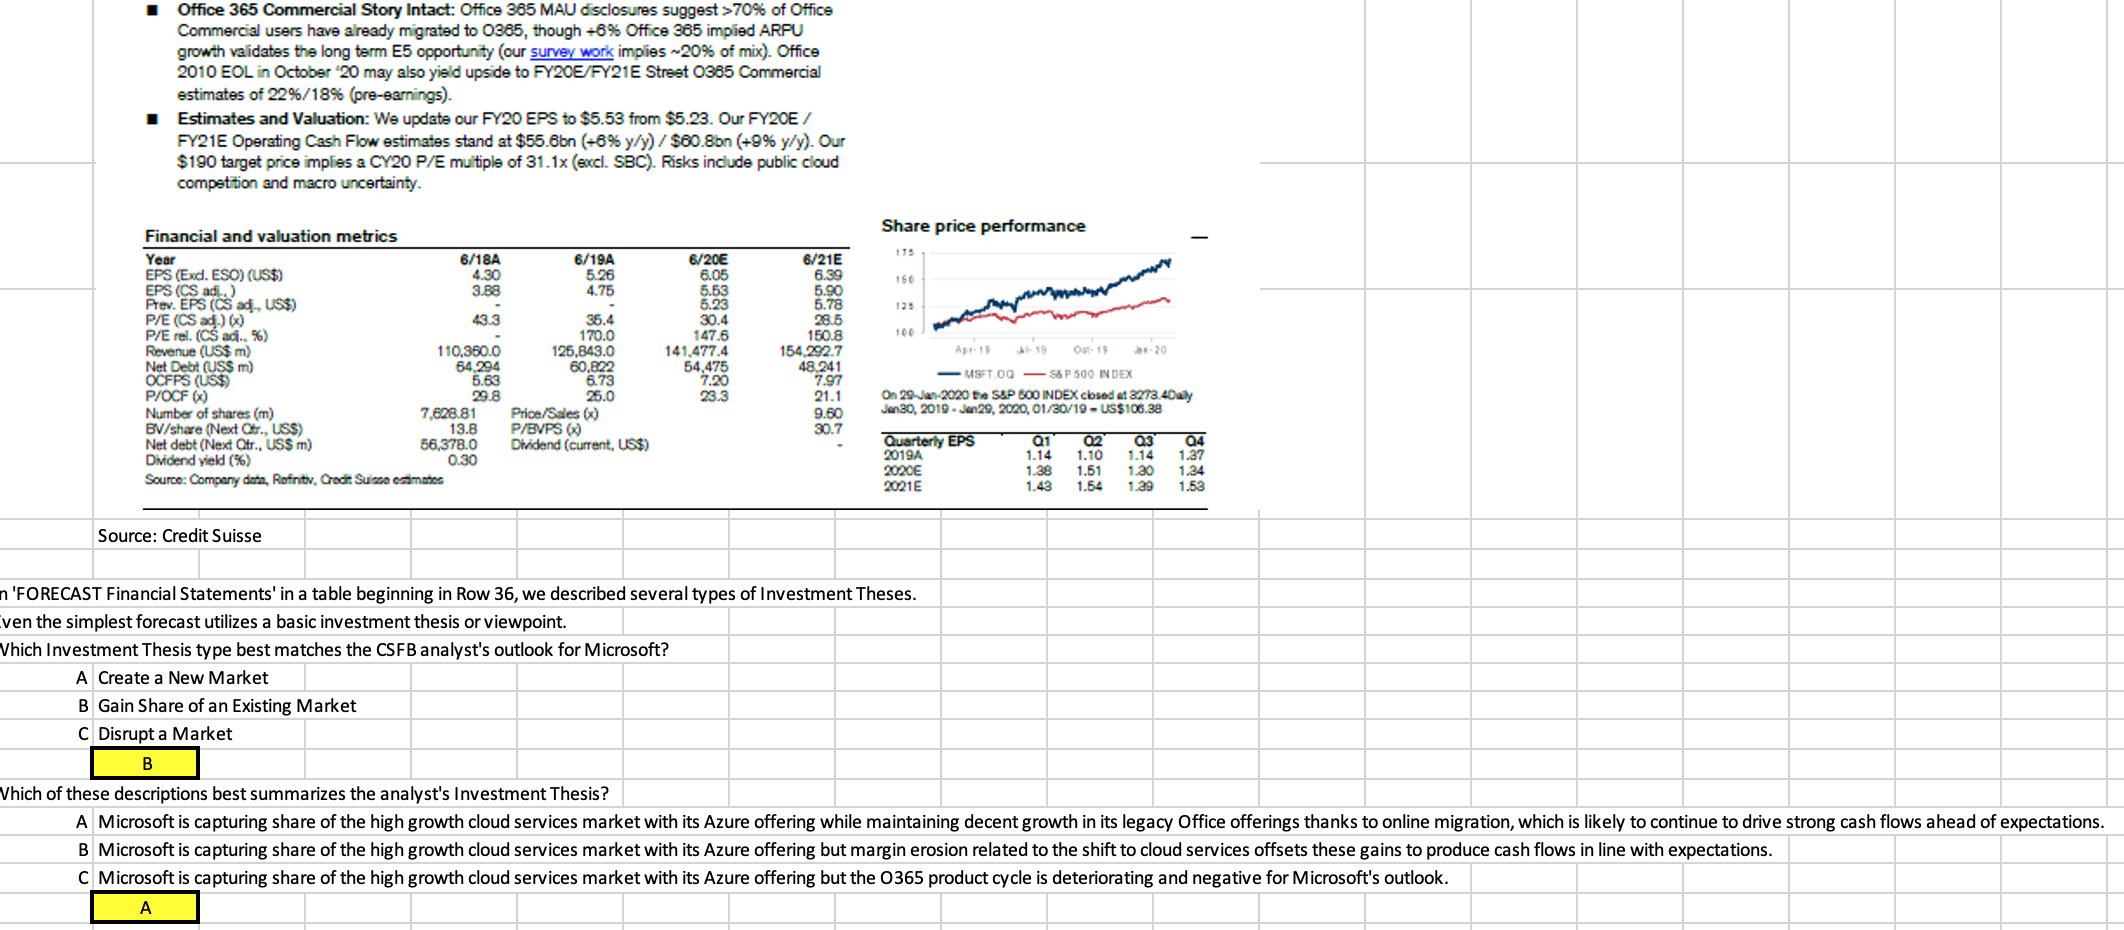
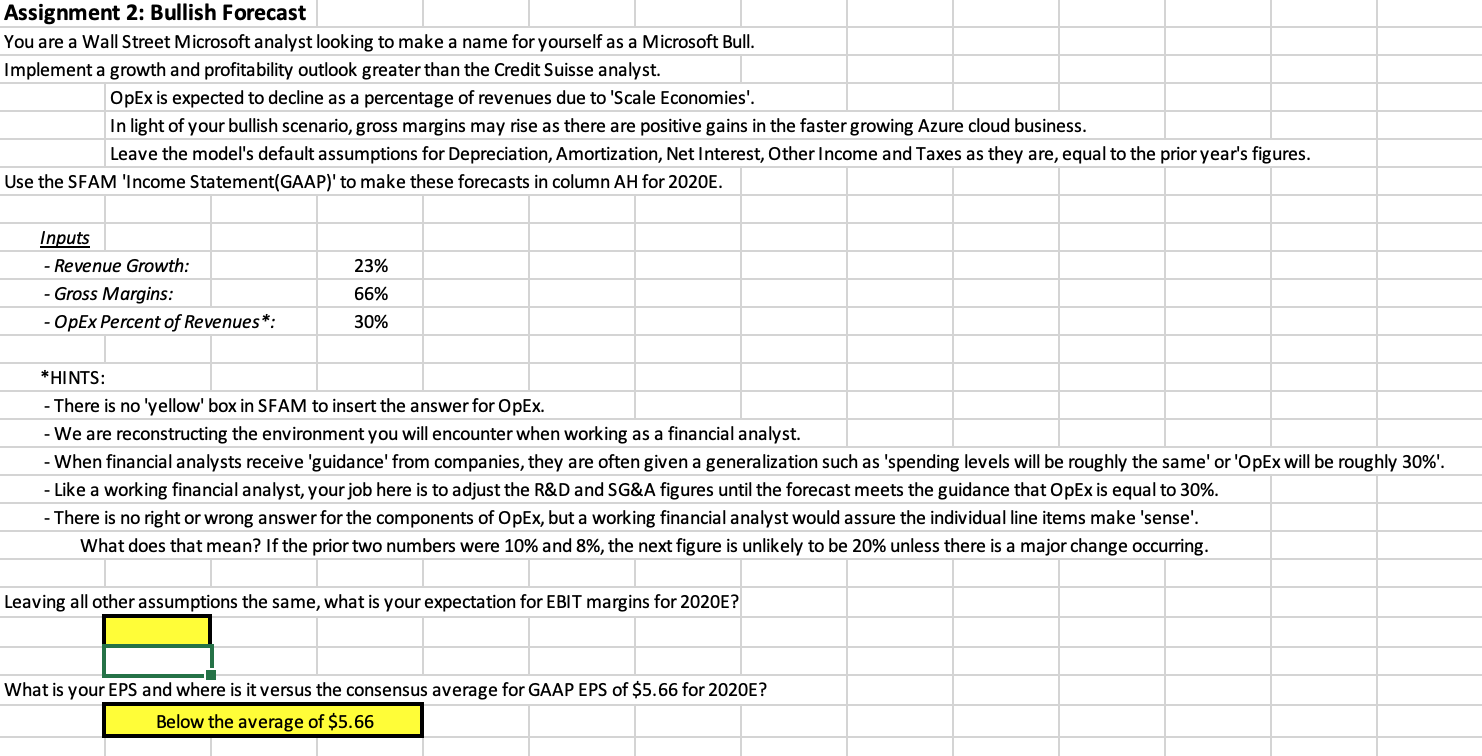
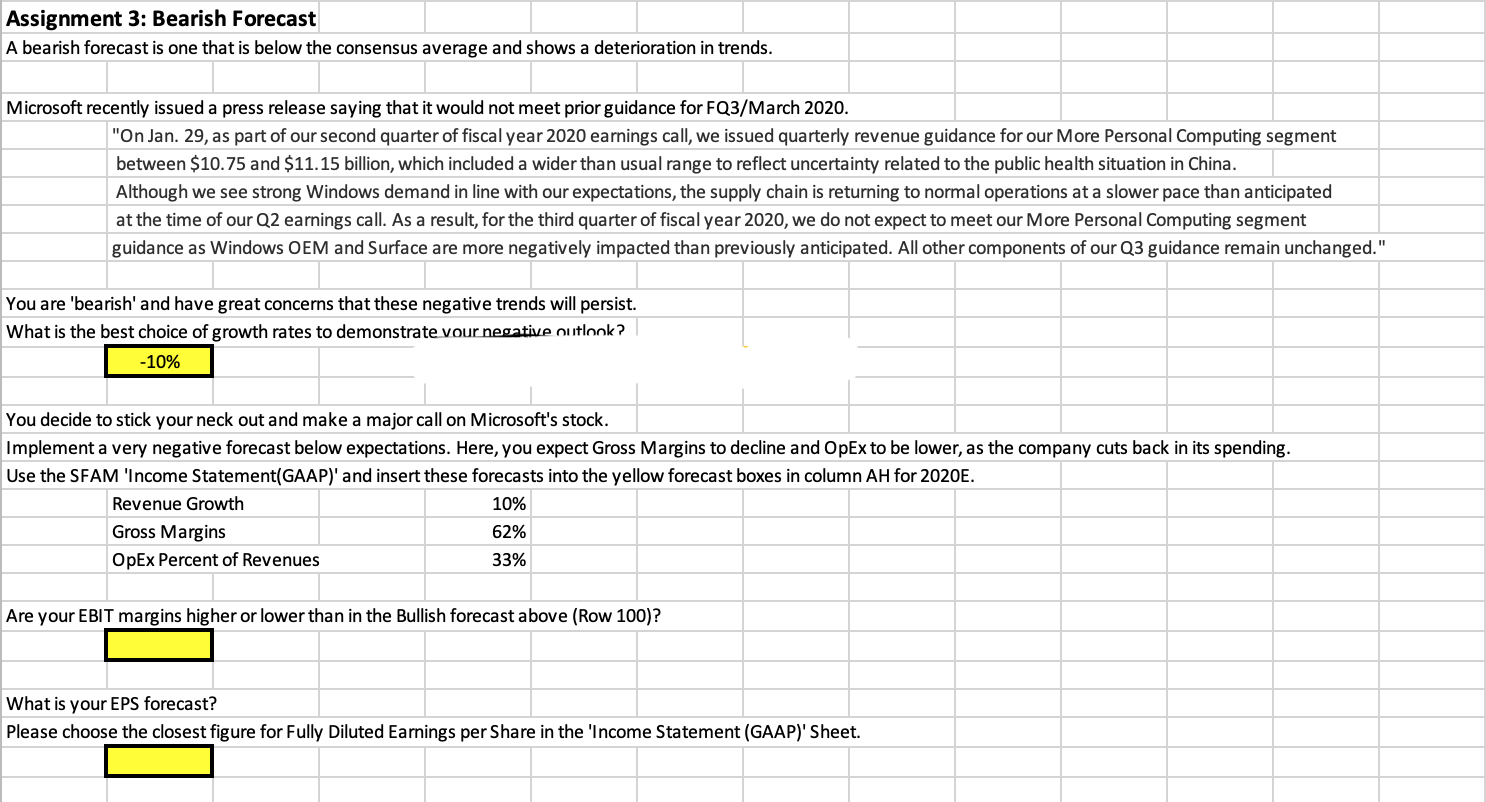
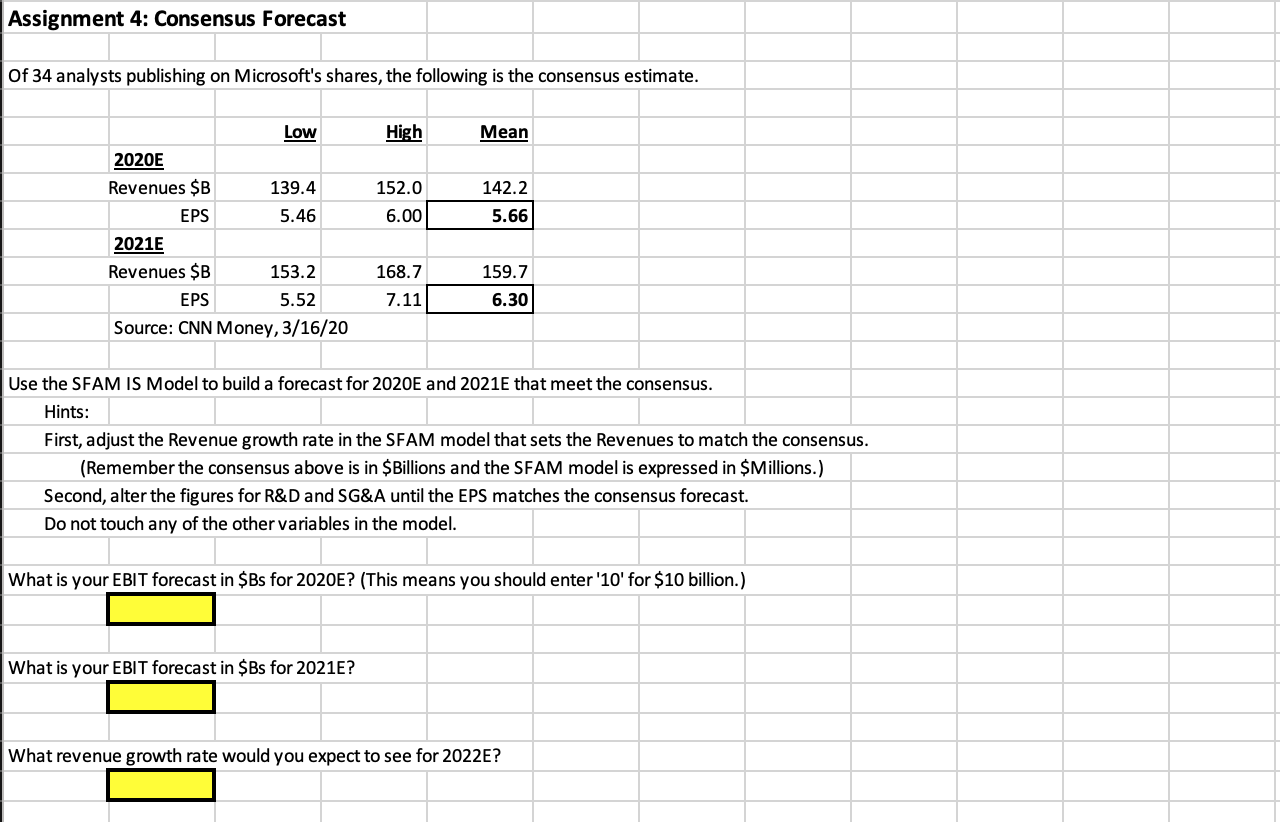
Assignment 1: Investment Thesis Microsoft has 34 analysts publishing an outlook for the company, 28 of which are Buy rated. Below is the Credit Suisse report issued on January 29 following fiscal Q2/December earnings. 29 January 2020 Equity Research Americas United States CREDIT SUISSE MSFT Microsoft F2020 Earnings - Accelerating Azure with Leverage Target price (12M, USS) 190.00 Outperform Software Increase Target Price Previous target price (12M, US$) 180.00 Price (29 Jan 20. USS) 168.04 52-week price range 168.04 - 102.78 Market cap (US$ m) 1.281.944.50 Enterprise value (US$ m) 1.996,420 Research Analysts Brad Zelnick Strong F20 results reaffim our thesis that Microsoft is capturing a generational opportunity in enterprise tech given its rapidly growing cloud business, healthy on-prem, and strong cash generation. While skeptics may question the margin impact of cloud mix shift, we underscore Azure GM progression and FY20 OM now guided +2 pts. yly vs. prior'slightly up'. Azure reacceleration validates Microsoft's hybrid and enterprise advantages, despite increasing investments by public cloud rivals. Microsoft 365 strength should continue to drive Office 365 ARPU uplift, and help sustain the Windows business post refresh cycle. We raise our Target Price to $190 (from $180) and reiterate our Outperform rating. I Azure and Server Products = Best Friends Forever: Azure grew +84% y/y cc, with gross margins continuing to scale up (CSe 55%, +1 pto/4), despite mix headwind. Adoption of Azure Hybrid Benefits by one-third of Windows Server and SOL Server enterprise customers speaks to Microsoft's strategic relationships and Azure synergies with the Server products business (+8% cc ex-Win Server 2008 EOL impact). EMS installed base-35% y/y, surprisingly stable vs. F10, with +7mn users q/q and better than we expected. We forecast Azure F30E / F40E growth at 56% / 47% y/y. 1 Windows 10 Refresh and M365: 18% y/y Windows OEM growth remains elevated, driven by Win 10 refresh, and CY20 will likely benefit from an improving PC supply chain. Exceptional 27% y/y cc growth in Windows Commercial products and Cloud services is driven by strong Microsoft 365 adoption, which we believe could be a multi-year phenomenon for the Windows business, albeit lumpy. Syed Talha Saleem, CFA Ray McDonough, CFA I Office 365 Commercial Story Intact: Office 365 MAU disclosures suggest >70% of Office Commercial users have already migrated to 0385, though -8% Office 365 implied ARPU growth validates the long term E5 opportunity (our survey work implies -20% of mix). Office 2010 EOL in October 20 may also yield upside to FY20E/FY21E Street 0385 Commercial estimates of 22%/18% (pre-earnings). I Estimates and Valuation: We update our FY20 EPS to $5.53 from $5.23. Our FY20E / FY21E Operating Cash Flow estimates stand at $55.8bn (-8% y/y) / $60.8bn (+9% y/y). Our $190 target price implies a CY20 P/E multiple of 31.1x (excl. SBC). Risks include public cloud competition and macro uncertainty. Share price performance ITS 6/19A 5.26 4.75 6/21E 6.39 5.90 5.78 160 120 28.5 1508 6/20E 6.05 5.53 5.23 30.4 147.6 141,477.4 54,475 7.20 23.3 O. 19 Financial and valuation metrics Year 6/18A EPS (Exd. ESO) (US$) 4.30 EPS (CS adi.) 3.88 Prev. EPS (Cs ad., US$) P/E (CS ad.) 6) 43.3 P/E rel. (C ad. %) Revenue (US$ m) 110,360.0 Net Debt (USS m) 84 294 OCFPS (US$) 5.63 P/OCF 6) 29.8 Number of shares (m) 7.628.81 BV/share (Next Ctr., USS) 13.8 Net debt (Next Ctr., US$ m) 56,378.0 Dividend yield (%) 0.30 Source: Company data, Refinitiv. Credit Suisse estimates 5.20 36.4 170.0 125.843.0 60,822 6.73 25.0 Price/Sales (0) P/BVPS (1) Dividend (current, US$) 154.292.7 48.241 7.97 21.1 9.60 30.7 MSFT.OG -S&P500 INDEX On 29-Jan-2020 the S&P 500 INDEX closed at 3273.4Daily Jan 30, 2019 Jan 20, 2020, 01/30/19 - US$106.30 Quarterly EPS 2019A 2020E 2021E Q1 1.14 1.38 1.43 02 1.10 1.61 1.64 03 1.14 1.30 1.29 04 1.37 1.34 1.53 Source: Credit Suisse n 'FORECAST Financial Statements' in a table beginning in Row 36, we described several types of Investment Theses. ven the simplest forecast utilizes a basic investment thesis or viewpoint. Vhich Investment Thesis type best matches the CSFB analyst's outlook for Microsoft? A Create a New Market B Gain Share of an Existing Market C Disrupt a Market B Vhich of these descriptions best summarizes the analyst's Investment Thesis? A Microsoft is capturing share of the high growth cloud services market with its Azure offering while maintaining decent growth in its legacy Office offerings thanks to online migration, which is likely to continue to drive strong cash flows ahead of expectations. B Microsoft is capturing share of the high growth cloud services market with its Azure offering but margin erosion related to the shift to cloud services offsets these gains to produce cash flows in line with expectations. C Microsoft is capturing share of the high growth cloud services market with its Azure offering but the O365 product cycle is deteriorating and negative for Microsoft's outlook. A Assignment 2: Bullish Forecast You are a Wall Street Microsoft analyst looking to make a name for yourself as a Microsoft Bull. Implement a growth and profitability outlook greater than the Credit Suisse analyst. OpEx is expected to decline as a percentage of revenues due to 'Scale Economies'. In light of your bullish scenario, gross margins may rise as there are positive gains in the faster growing Azure cloud business. Leave the model's default assumptions for Depreciation, Amortization, Net Interest, Other Income and Taxes as they are, equal to the prior year's figures. Use the SFAM 'Income Statement(GAAP)' to make these forecasts in column AH for 2020E. 23% Inputs Revenue Growth: - Gross Margins: - OpEx Percent of Revenues*: 66% 30% *HINTS: - There is no 'yellow' box in SFAM to insert the answer for OpEx. - We are reconstructing the environment you will encounter when working as a financial analyst. - When financial analysts receive 'guidan from companies, they are often given a generalization such as 'spending levels will be roughly the same' or 'OpEx will be roughly 30%'. - Like a working financial analyst, your job here is to adjust the R&D and SG&A figures until the forecast meets the guidance that OpEx is equal to 30%. - There is no right or wrong answer for the components of Opex, but a working financial analyst would assure the individual line items make 'sense'. What does that mean? If the prior two numbers were 10% and 8%, the next figure is unlikely to be 20% unless there is a major change occurring. Leaving all other assumptions the same, what is your expectation for EBIT margins for 2020E? What is your EPS and where is it versus the consensus average for GAAP EPS of $5.66 for 2020E? Below the average of $5.66 Assignment 3: Bearish Forecast A bearish forecast is one that is below the consensus average and shows a deterioration in trends. Microsoft recently issued a press release saying that it would not meet prior guidance for FQ3/March 2020. "On Jan. 29, as part of our second quarter of fiscal year 2020 earnings call, we issued quarterly revenue guidance for our More Personal Computing segment between $10.75 and $11.15 billion, which included a wider than usual range to reflect uncertainty related to the public health situation in China. Although we see strong Windows demand in line with our expectations, the supply chain is returning to normal operations at a slower pace than anticipated at the time of our Q2 earnings call. As a result, for the third quarter of fiscal year 2020, we do not expect to meet our More Personal Computing segment guidance as Windows OEM and Surface are more negatively impacted than previously anticipated. All other components of our Q3 guidance remain unchanged." You are 'bearish' and have great concerns that these negative trends will persist. What is the best choice of growth rates to demonstrate vour negative outlook? -10% You decide to stick your neck out and make a major call on Microsoft's stock. Implement a very negative forecast below expectations. Here, you expect Gross Margins to decline and OpEx to be lower, as the company cuts back in its spending. Use the SFAM 'Income Statement(GAAP)' and insert these forecasts into the yellow forecast boxes in column AH for 2020E. Revenue Growth 10% Gross Margins 62% OpEx Percent of Revenues 33% Are your EBIT margins higher or lower than in the Bullish forecast above (Row 100)? What is your EPS forecast? Please choose the closest figure for Fully Diluted Earnings per Share in the 'Income Statement (GAAP)' Sheet. Assignment 4: Consensus Forecast Of 34 analysts publishing on Microsoft's shares, the following is the consensus estimate. High Mean 152.0 6.00 142.2 5.66 Low 2020E Revenues $B 139.4 EPS 5.46 2021E Revenues $B 153.2 EPS 5.52 Source: CNN Money, 3/16/20 168.7 159.7 6.30 7.11 Use the SFAM IS Model to build a forecast for 2020E and 2021E that meet the consensus. Hints: First, adjust the Revenue growth rate in the SFAM model that sets the Revenues to match the consensus. (Remember the consensus above is in $Billions and the SFAM model is expressed in $Millions.) Second, alter the figures for R&D and SG&A until the EPS matches the consensus forecast. Do not touch any of the other variables in the model. What is your EBIT forecast in $Bs for 2020E? (This means you should enter '10' for $10 billion.) What is your EBIT forecast in $Bs for 2021E? What revenue growth rate would you expect to see for 2022E? Assignment 1: Investment Thesis Microsoft has 34 analysts publishing an outlook for the company, 28 of which are Buy rated. Below is the Credit Suisse report issued on January 29 following fiscal Q2/December earnings. 29 January 2020 Equity Research Americas United States CREDIT SUISSE MSFT Microsoft F2020 Earnings - Accelerating Azure with Leverage Target price (12M, USS) 190.00 Outperform Software Increase Target Price Previous target price (12M, US$) 180.00 Price (29 Jan 20. USS) 168.04 52-week price range 168.04 - 102.78 Market cap (US$ m) 1.281.944.50 Enterprise value (US$ m) 1.996,420 Research Analysts Brad Zelnick Strong F20 results reaffim our thesis that Microsoft is capturing a generational opportunity in enterprise tech given its rapidly growing cloud business, healthy on-prem, and strong cash generation. While skeptics may question the margin impact of cloud mix shift, we underscore Azure GM progression and FY20 OM now guided +2 pts. yly vs. prior'slightly up'. Azure reacceleration validates Microsoft's hybrid and enterprise advantages, despite increasing investments by public cloud rivals. Microsoft 365 strength should continue to drive Office 365 ARPU uplift, and help sustain the Windows business post refresh cycle. We raise our Target Price to $190 (from $180) and reiterate our Outperform rating. I Azure and Server Products = Best Friends Forever: Azure grew +84% y/y cc, with gross margins continuing to scale up (CSe 55%, +1 pto/4), despite mix headwind. Adoption of Azure Hybrid Benefits by one-third of Windows Server and SOL Server enterprise customers speaks to Microsoft's strategic relationships and Azure synergies with the Server products business (+8% cc ex-Win Server 2008 EOL impact). EMS installed base-35% y/y, surprisingly stable vs. F10, with +7mn users q/q and better than we expected. We forecast Azure F30E / F40E growth at 56% / 47% y/y. 1 Windows 10 Refresh and M365: 18% y/y Windows OEM growth remains elevated, driven by Win 10 refresh, and CY20 will likely benefit from an improving PC supply chain. Exceptional 27% y/y cc growth in Windows Commercial products and Cloud services is driven by strong Microsoft 365 adoption, which we believe could be a multi-year phenomenon for the Windows business, albeit lumpy. Syed Talha Saleem, CFA Ray McDonough, CFA I Office 365 Commercial Story Intact: Office 365 MAU disclosures suggest >70% of Office Commercial users have already migrated to 0385, though -8% Office 365 implied ARPU growth validates the long term E5 opportunity (our survey work implies -20% of mix). Office 2010 EOL in October 20 may also yield upside to FY20E/FY21E Street 0385 Commercial estimates of 22%/18% (pre-earnings). I Estimates and Valuation: We update our FY20 EPS to $5.53 from $5.23. Our FY20E / FY21E Operating Cash Flow estimates stand at $55.8bn (-8% y/y) / $60.8bn (+9% y/y). Our $190 target price implies a CY20 P/E multiple of 31.1x (excl. SBC). Risks include public cloud competition and macro uncertainty. Share price performance ITS 6/19A 5.26 4.75 6/21E 6.39 5.90 5.78 160 120 28.5 1508 6/20E 6.05 5.53 5.23 30.4 147.6 141,477.4 54,475 7.20 23.3 O. 19 Financial and valuation metrics Year 6/18A EPS (Exd. ESO) (US$) 4.30 EPS (CS adi.) 3.88 Prev. EPS (Cs ad., US$) P/E (CS ad.) 6) 43.3 P/E rel. (C ad. %) Revenue (US$ m) 110,360.0 Net Debt (USS m) 84 294 OCFPS (US$) 5.63 P/OCF 6) 29.8 Number of shares (m) 7.628.81 BV/share (Next Ctr., USS) 13.8 Net debt (Next Ctr., US$ m) 56,378.0 Dividend yield (%) 0.30 Source: Company data, Refinitiv. Credit Suisse estimates 5.20 36.4 170.0 125.843.0 60,822 6.73 25.0 Price/Sales (0) P/BVPS (1) Dividend (current, US$) 154.292.7 48.241 7.97 21.1 9.60 30.7 MSFT.OG -S&P500 INDEX On 29-Jan-2020 the S&P 500 INDEX closed at 3273.4Daily Jan 30, 2019 Jan 20, 2020, 01/30/19 - US$106.30 Quarterly EPS 2019A 2020E 2021E Q1 1.14 1.38 1.43 02 1.10 1.61 1.64 03 1.14 1.30 1.29 04 1.37 1.34 1.53 Source: Credit Suisse n 'FORECAST Financial Statements' in a table beginning in Row 36, we described several types of Investment Theses. ven the simplest forecast utilizes a basic investment thesis or viewpoint. Vhich Investment Thesis type best matches the CSFB analyst's outlook for Microsoft? A Create a New Market B Gain Share of an Existing Market C Disrupt a Market B Vhich of these descriptions best summarizes the analyst's Investment Thesis? A Microsoft is capturing share of the high growth cloud services market with its Azure offering while maintaining decent growth in its legacy Office offerings thanks to online migration, which is likely to continue to drive strong cash flows ahead of expectations. B Microsoft is capturing share of the high growth cloud services market with its Azure offering but margin erosion related to the shift to cloud services offsets these gains to produce cash flows in line with expectations. C Microsoft is capturing share of the high growth cloud services market with its Azure offering but the O365 product cycle is deteriorating and negative for Microsoft's outlook. A Assignment 2: Bullish Forecast You are a Wall Street Microsoft analyst looking to make a name for yourself as a Microsoft Bull. Implement a growth and profitability outlook greater than the Credit Suisse analyst. OpEx is expected to decline as a percentage of revenues due to 'Scale Economies'. In light of your bullish scenario, gross margins may rise as there are positive gains in the faster growing Azure cloud business. Leave the model's default assumptions for Depreciation, Amortization, Net Interest, Other Income and Taxes as they are, equal to the prior year's figures. Use the SFAM 'Income Statement(GAAP)' to make these forecasts in column AH for 2020E. 23% Inputs Revenue Growth: - Gross Margins: - OpEx Percent of Revenues*: 66% 30% *HINTS: - There is no 'yellow' box in SFAM to insert the answer for OpEx. - We are reconstructing the environment you will encounter when working as a financial analyst. - When financial analysts receive 'guidan from companies, they are often given a generalization such as 'spending levels will be roughly the same' or 'OpEx will be roughly 30%'. - Like a working financial analyst, your job here is to adjust the R&D and SG&A figures until the forecast meets the guidance that OpEx is equal to 30%. - There is no right or wrong answer for the components of Opex, but a working financial analyst would assure the individual line items make 'sense'. What does that mean? If the prior two numbers were 10% and 8%, the next figure is unlikely to be 20% unless there is a major change occurring. Leaving all other assumptions the same, what is your expectation for EBIT margins for 2020E? What is your EPS and where is it versus the consensus average for GAAP EPS of $5.66 for 2020E? Below the average of $5.66 Assignment 3: Bearish Forecast A bearish forecast is one that is below the consensus average and shows a deterioration in trends. Microsoft recently issued a press release saying that it would not meet prior guidance for FQ3/March 2020. "On Jan. 29, as part of our second quarter of fiscal year 2020 earnings call, we issued quarterly revenue guidance for our More Personal Computing segment between $10.75 and $11.15 billion, which included a wider than usual range to reflect uncertainty related to the public health situation in China. Although we see strong Windows demand in line with our expectations, the supply chain is returning to normal operations at a slower pace than anticipated at the time of our Q2 earnings call. As a result, for the third quarter of fiscal year 2020, we do not expect to meet our More Personal Computing segment guidance as Windows OEM and Surface are more negatively impacted than previously anticipated. All other components of our Q3 guidance remain unchanged." You are 'bearish' and have great concerns that these negative trends will persist. What is the best choice of growth rates to demonstrate vour negative outlook? -10% You decide to stick your neck out and make a major call on Microsoft's stock. Implement a very negative forecast below expectations. Here, you expect Gross Margins to decline and OpEx to be lower, as the company cuts back in its spending. Use the SFAM 'Income Statement(GAAP)' and insert these forecasts into the yellow forecast boxes in column AH for 2020E. Revenue Growth 10% Gross Margins 62% OpEx Percent of Revenues 33% Are your EBIT margins higher or lower than in the Bullish forecast above (Row 100)? What is your EPS forecast? Please choose the closest figure for Fully Diluted Earnings per Share in the 'Income Statement (GAAP)' Sheet. Assignment 4: Consensus Forecast Of 34 analysts publishing on Microsoft's shares, the following is the consensus estimate. High Mean 152.0 6.00 142.2 5.66 Low 2020E Revenues $B 139.4 EPS 5.46 2021E Revenues $B 153.2 EPS 5.52 Source: CNN Money, 3/16/20 168.7 159.7 6.30 7.11 Use the SFAM IS Model to build a forecast for 2020E and 2021E that meet the consensus. Hints: First, adjust the Revenue growth rate in the SFAM model that sets the Revenues to match the consensus. (Remember the consensus above is in $Billions and the SFAM model is expressed in $Millions.) Second, alter the figures for R&D and SG&A until the EPS matches the consensus forecast. Do not touch any of the other variables in the model. What is your EBIT forecast in $Bs for 2020E? (This means you should enter '10' for $10 billion.) What is your EBIT forecast in $Bs for 2021E? What revenue growth rate would you expect to see for 2022E


