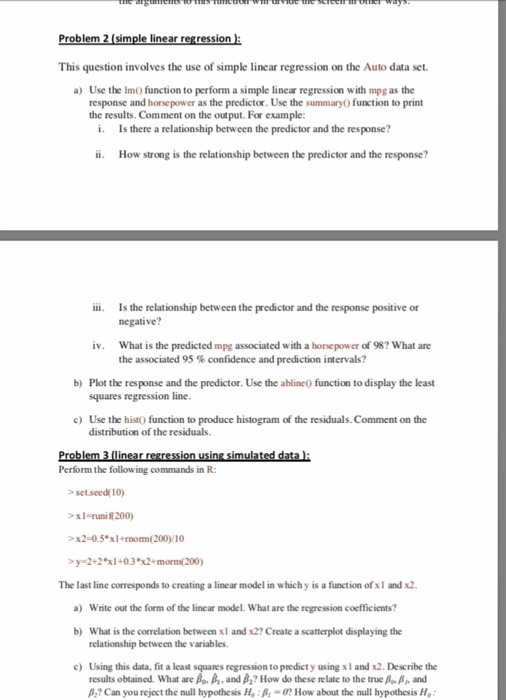
Assignment 1 This exercise relates to the College data set, which can be found in the file College.csv http://www-bef ase edu/-gareth ISLUdata html). It contains a number of variables for 777 different universities and colleges in the US. Before reading the data into R it can be viewed in Excel or a text editor a) Use the read csvo function to read the data into R. Call the loaded data college. Make sure that you have the directory set to the cormect location for the data We need to eliminate the first column in the data where the names are stored. Try: fixicollege) b) i. Use the summaryO function to produce a numerical summary of the variables in the data set. ii. Use the pairsO function to produce a scatterplot matrix of the first ten columns or variables of the data. Recall that you can reference the first ten columns of a matrix A using Al I:10 ii. What is the range of each quantitative variable? You can answer this using the nge( ) function. What is the mean and standard deviation of each quantitative variable? Use the histO function to produce some histograms with differing numbers of bins for a few of the quantitative variables. You may find the command parimfrow-c(2.2)) useful: it will divide the print window into four regions so that four plots can be made simultaneously. Modifying the arguments to this function will divide the screen in other ways. v. This question involves the use of simple linear regression on the Auto data set Use the Im function to perform a simple linear regression with mpg as the response and horsepower as the predictor. Use the summaryO function to print the results. Comment on the output. For example: a) i. Is there a relationship between the predictor and the response i How strong is the relationship between the predictor and the response? Assignment 1 This exercise relates to the College data set, which can be found in the file College.csv http://www-bef ase edu/-gareth ISLUdata html). It contains a number of variables for 777 different universities and colleges in the US. Before reading the data into R it can be viewed in Excel or a text editor a) Use the read csvo function to read the data into R. Call the loaded data college. Make sure that you have the directory set to the cormect location for the data We need to eliminate the first column in the data where the names are stored. Try: fixicollege) b) i. Use the summaryO function to produce a numerical summary of the variables in the data set. ii. Use the pairsO function to produce a scatterplot matrix of the first ten columns or variables of the data. Recall that you can reference the first ten columns of a matrix A using Al I:10 ii. What is the range of each quantitative variable? You can answer this using the nge( ) function. What is the mean and standard deviation of each quantitative variable? Use the histO function to produce some histograms with differing numbers of bins for a few of the quantitative variables. You may find the command parimfrow-c(2.2)) useful: it will divide the print window into four regions so that four plots can be made simultaneously. Modifying the arguments to this function will divide the screen in other ways. v. This question involves the use of simple linear regression on the Auto data set Use the Im function to perform a simple linear regression with mpg as the response and horsepower as the predictor. Use the summaryO function to print the results. Comment on the output. For example: a) i. Is there a relationship between the predictor and the response i How strong is the relationship between the predictor and the response


