

Answered step by step
Verified Expert Solution
Question
1 Approved Answer
Assignment 4: Problem 3 (1 point) The Capital Asset Price Model (CAPM) is a financial model that attempts to predict the rate of return
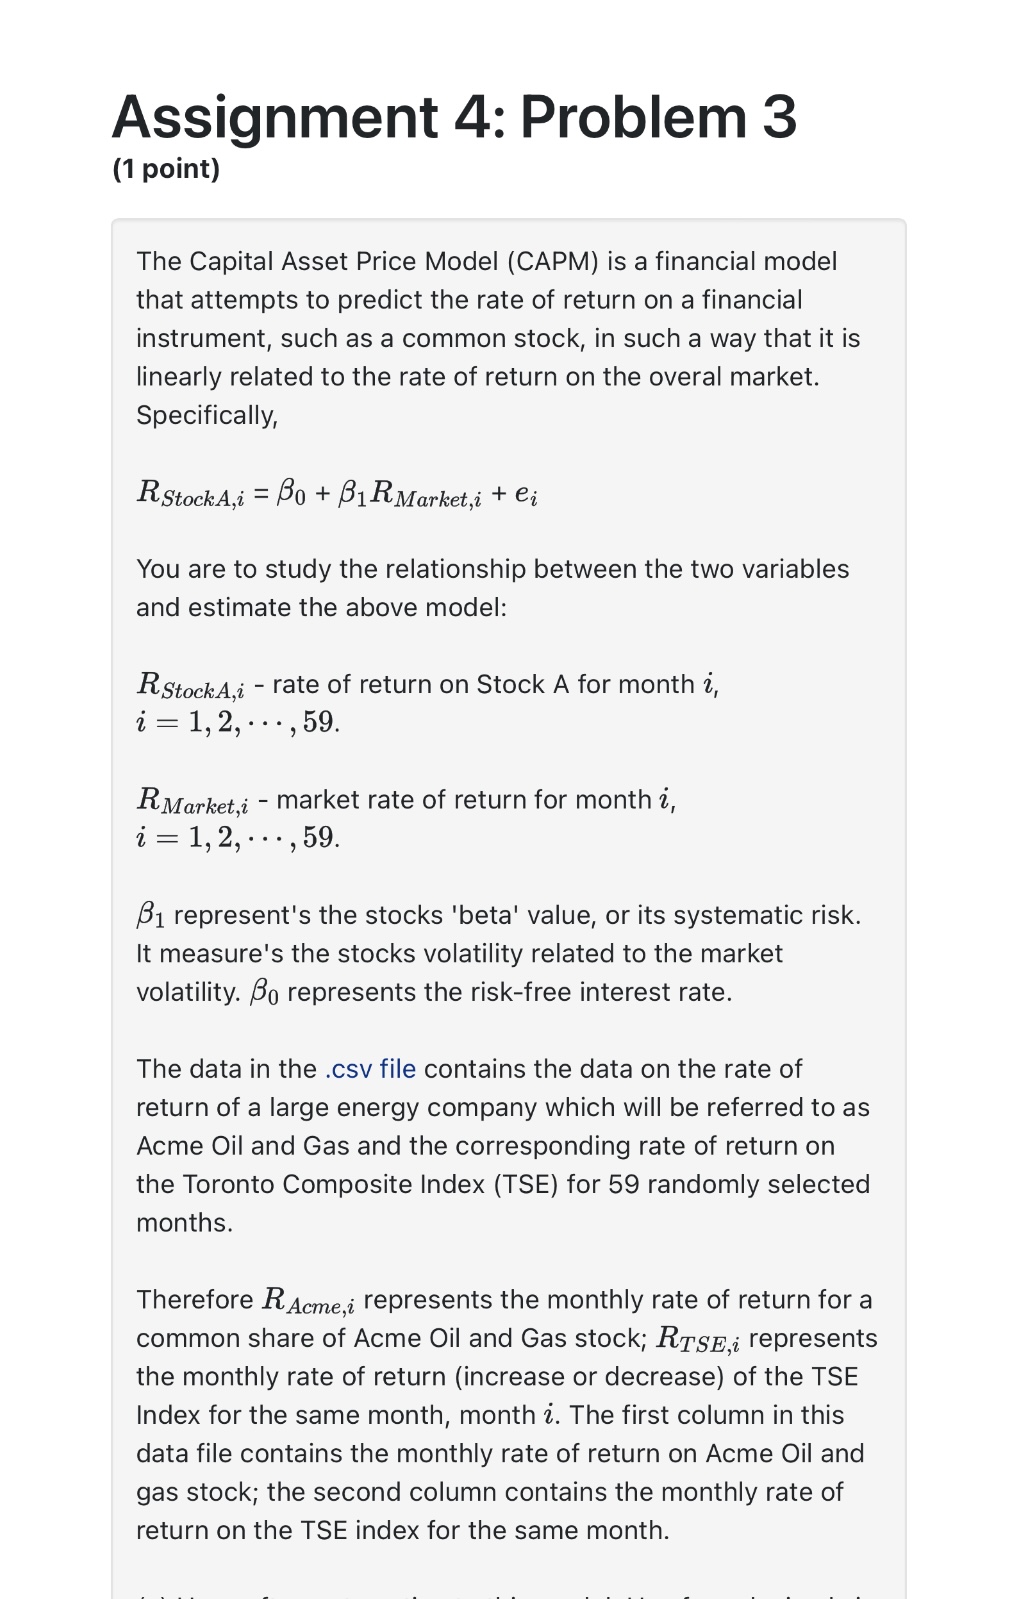
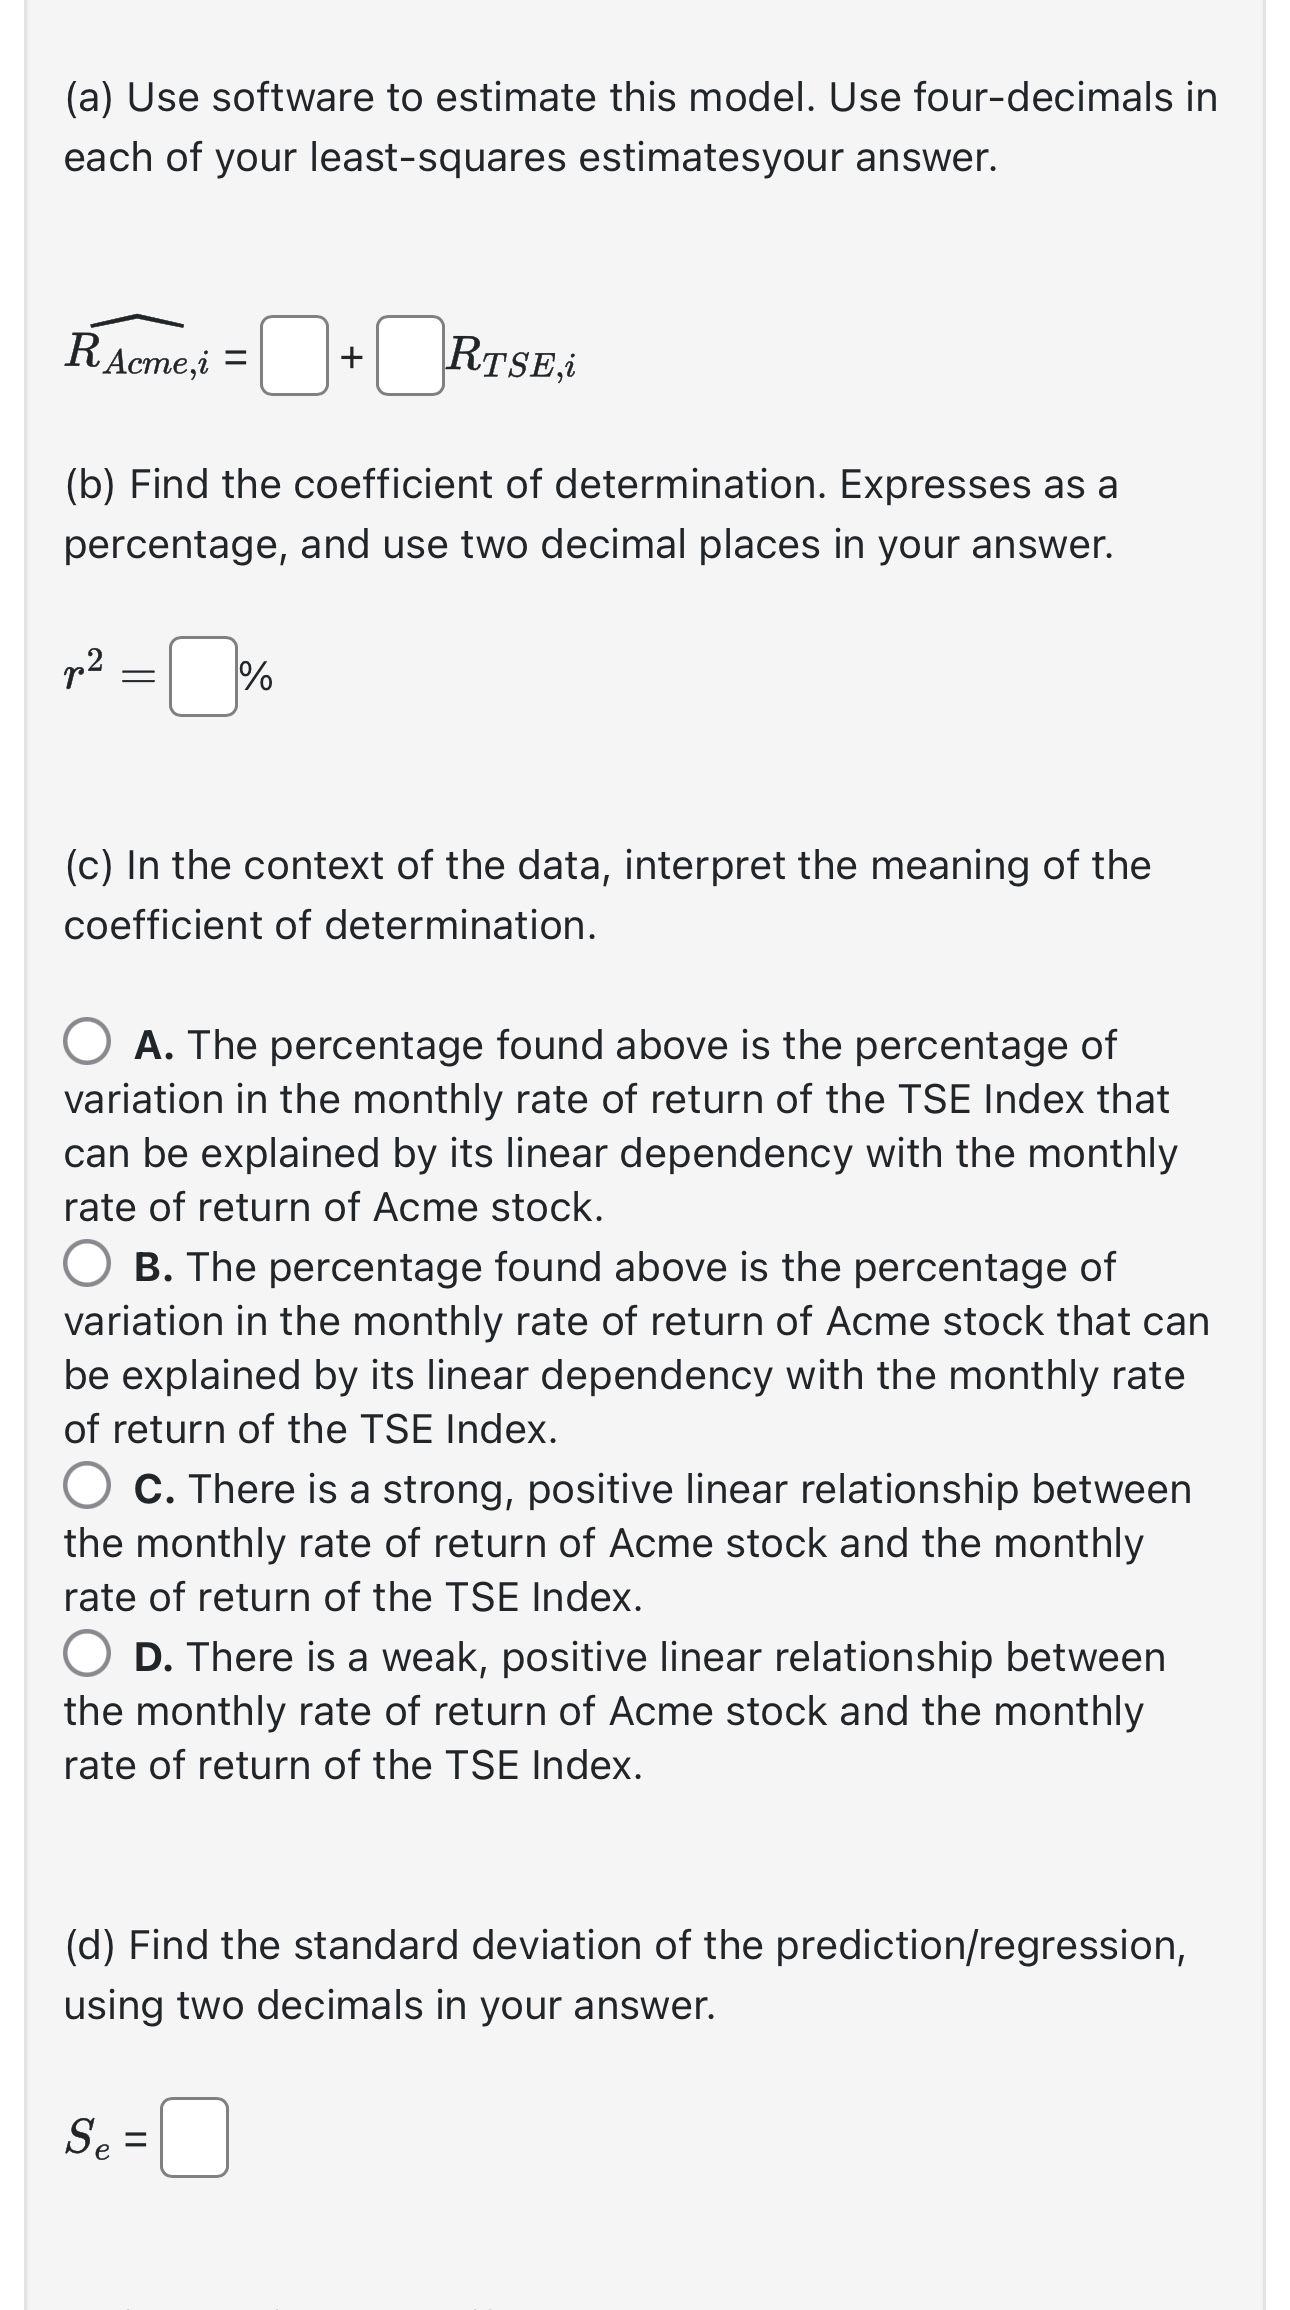
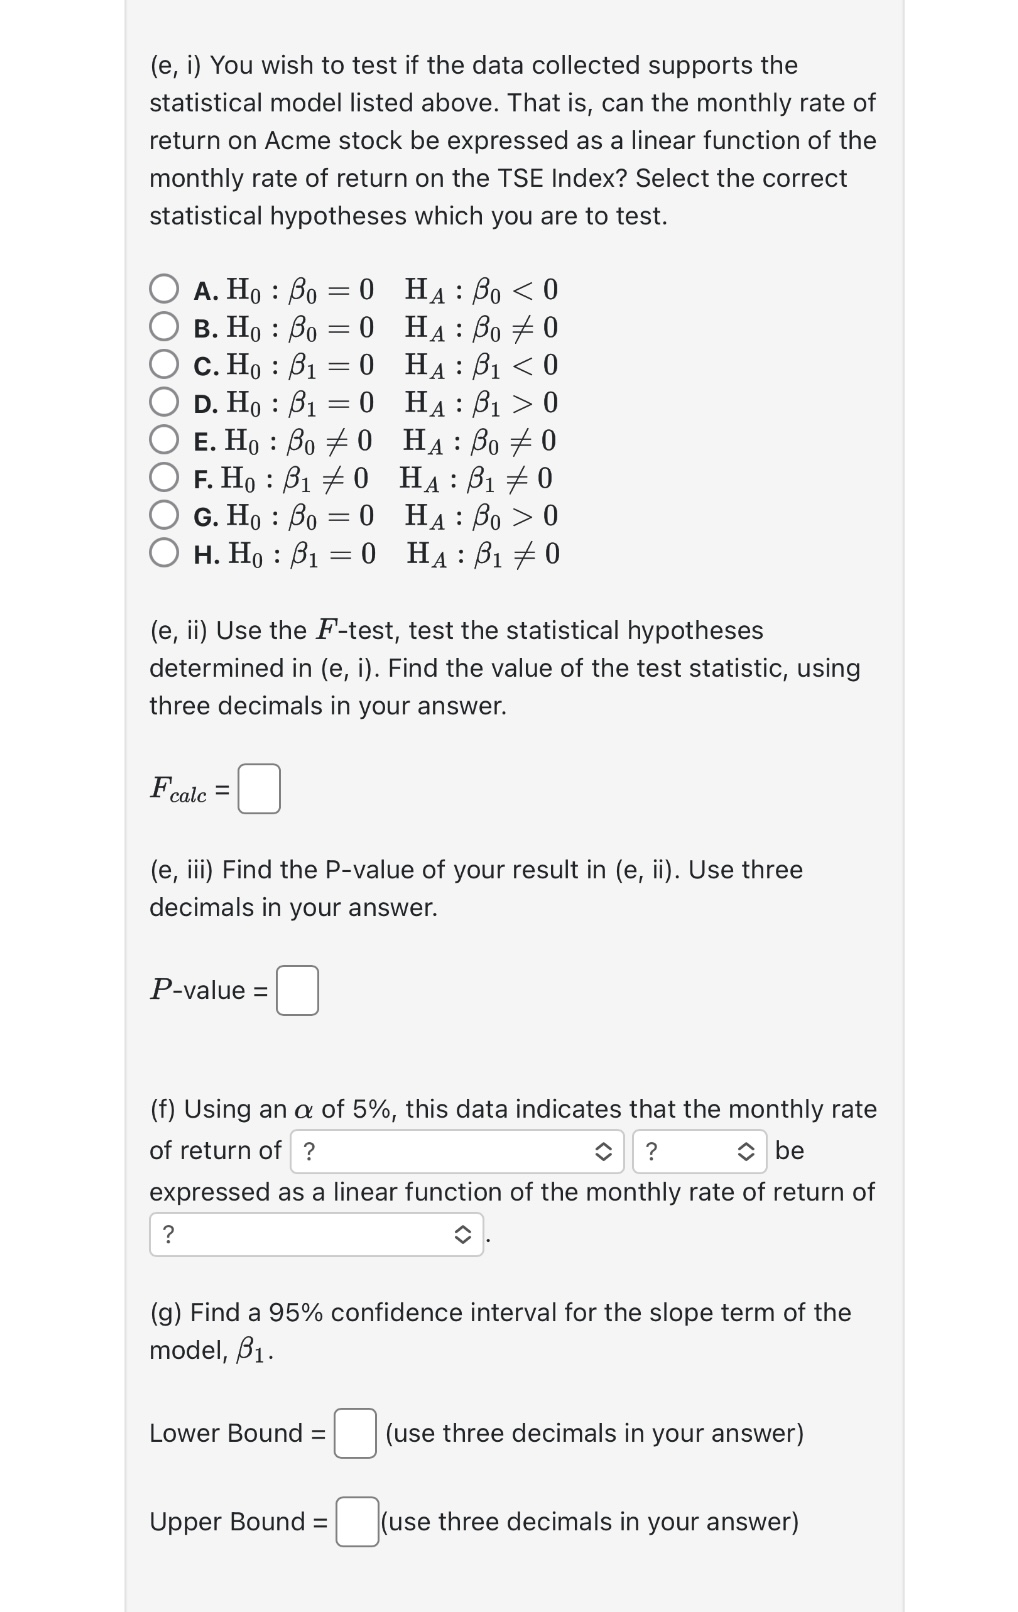
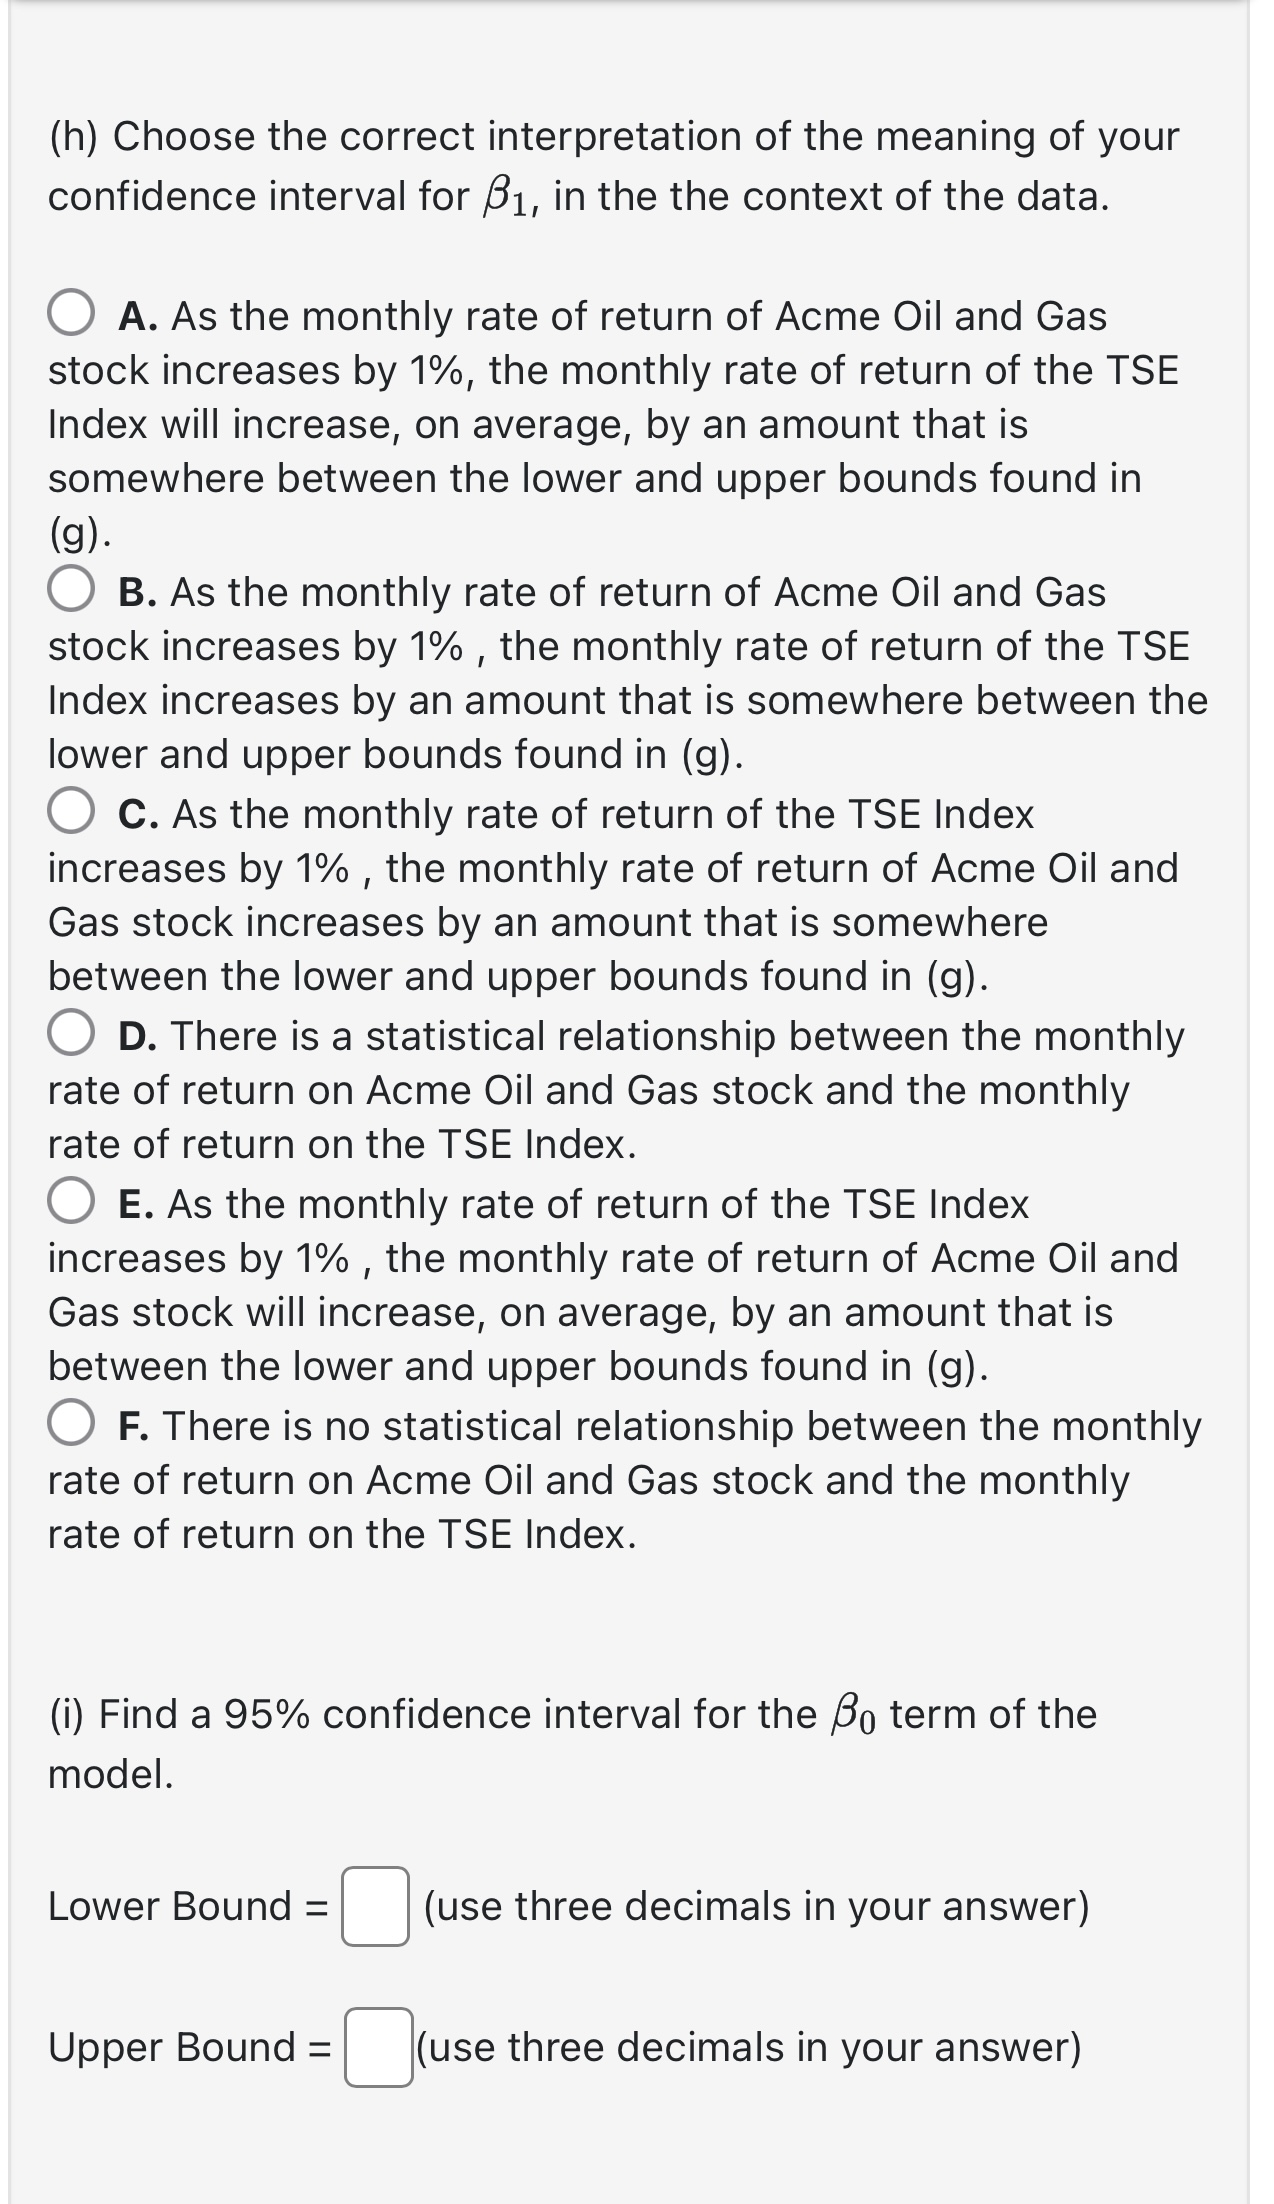
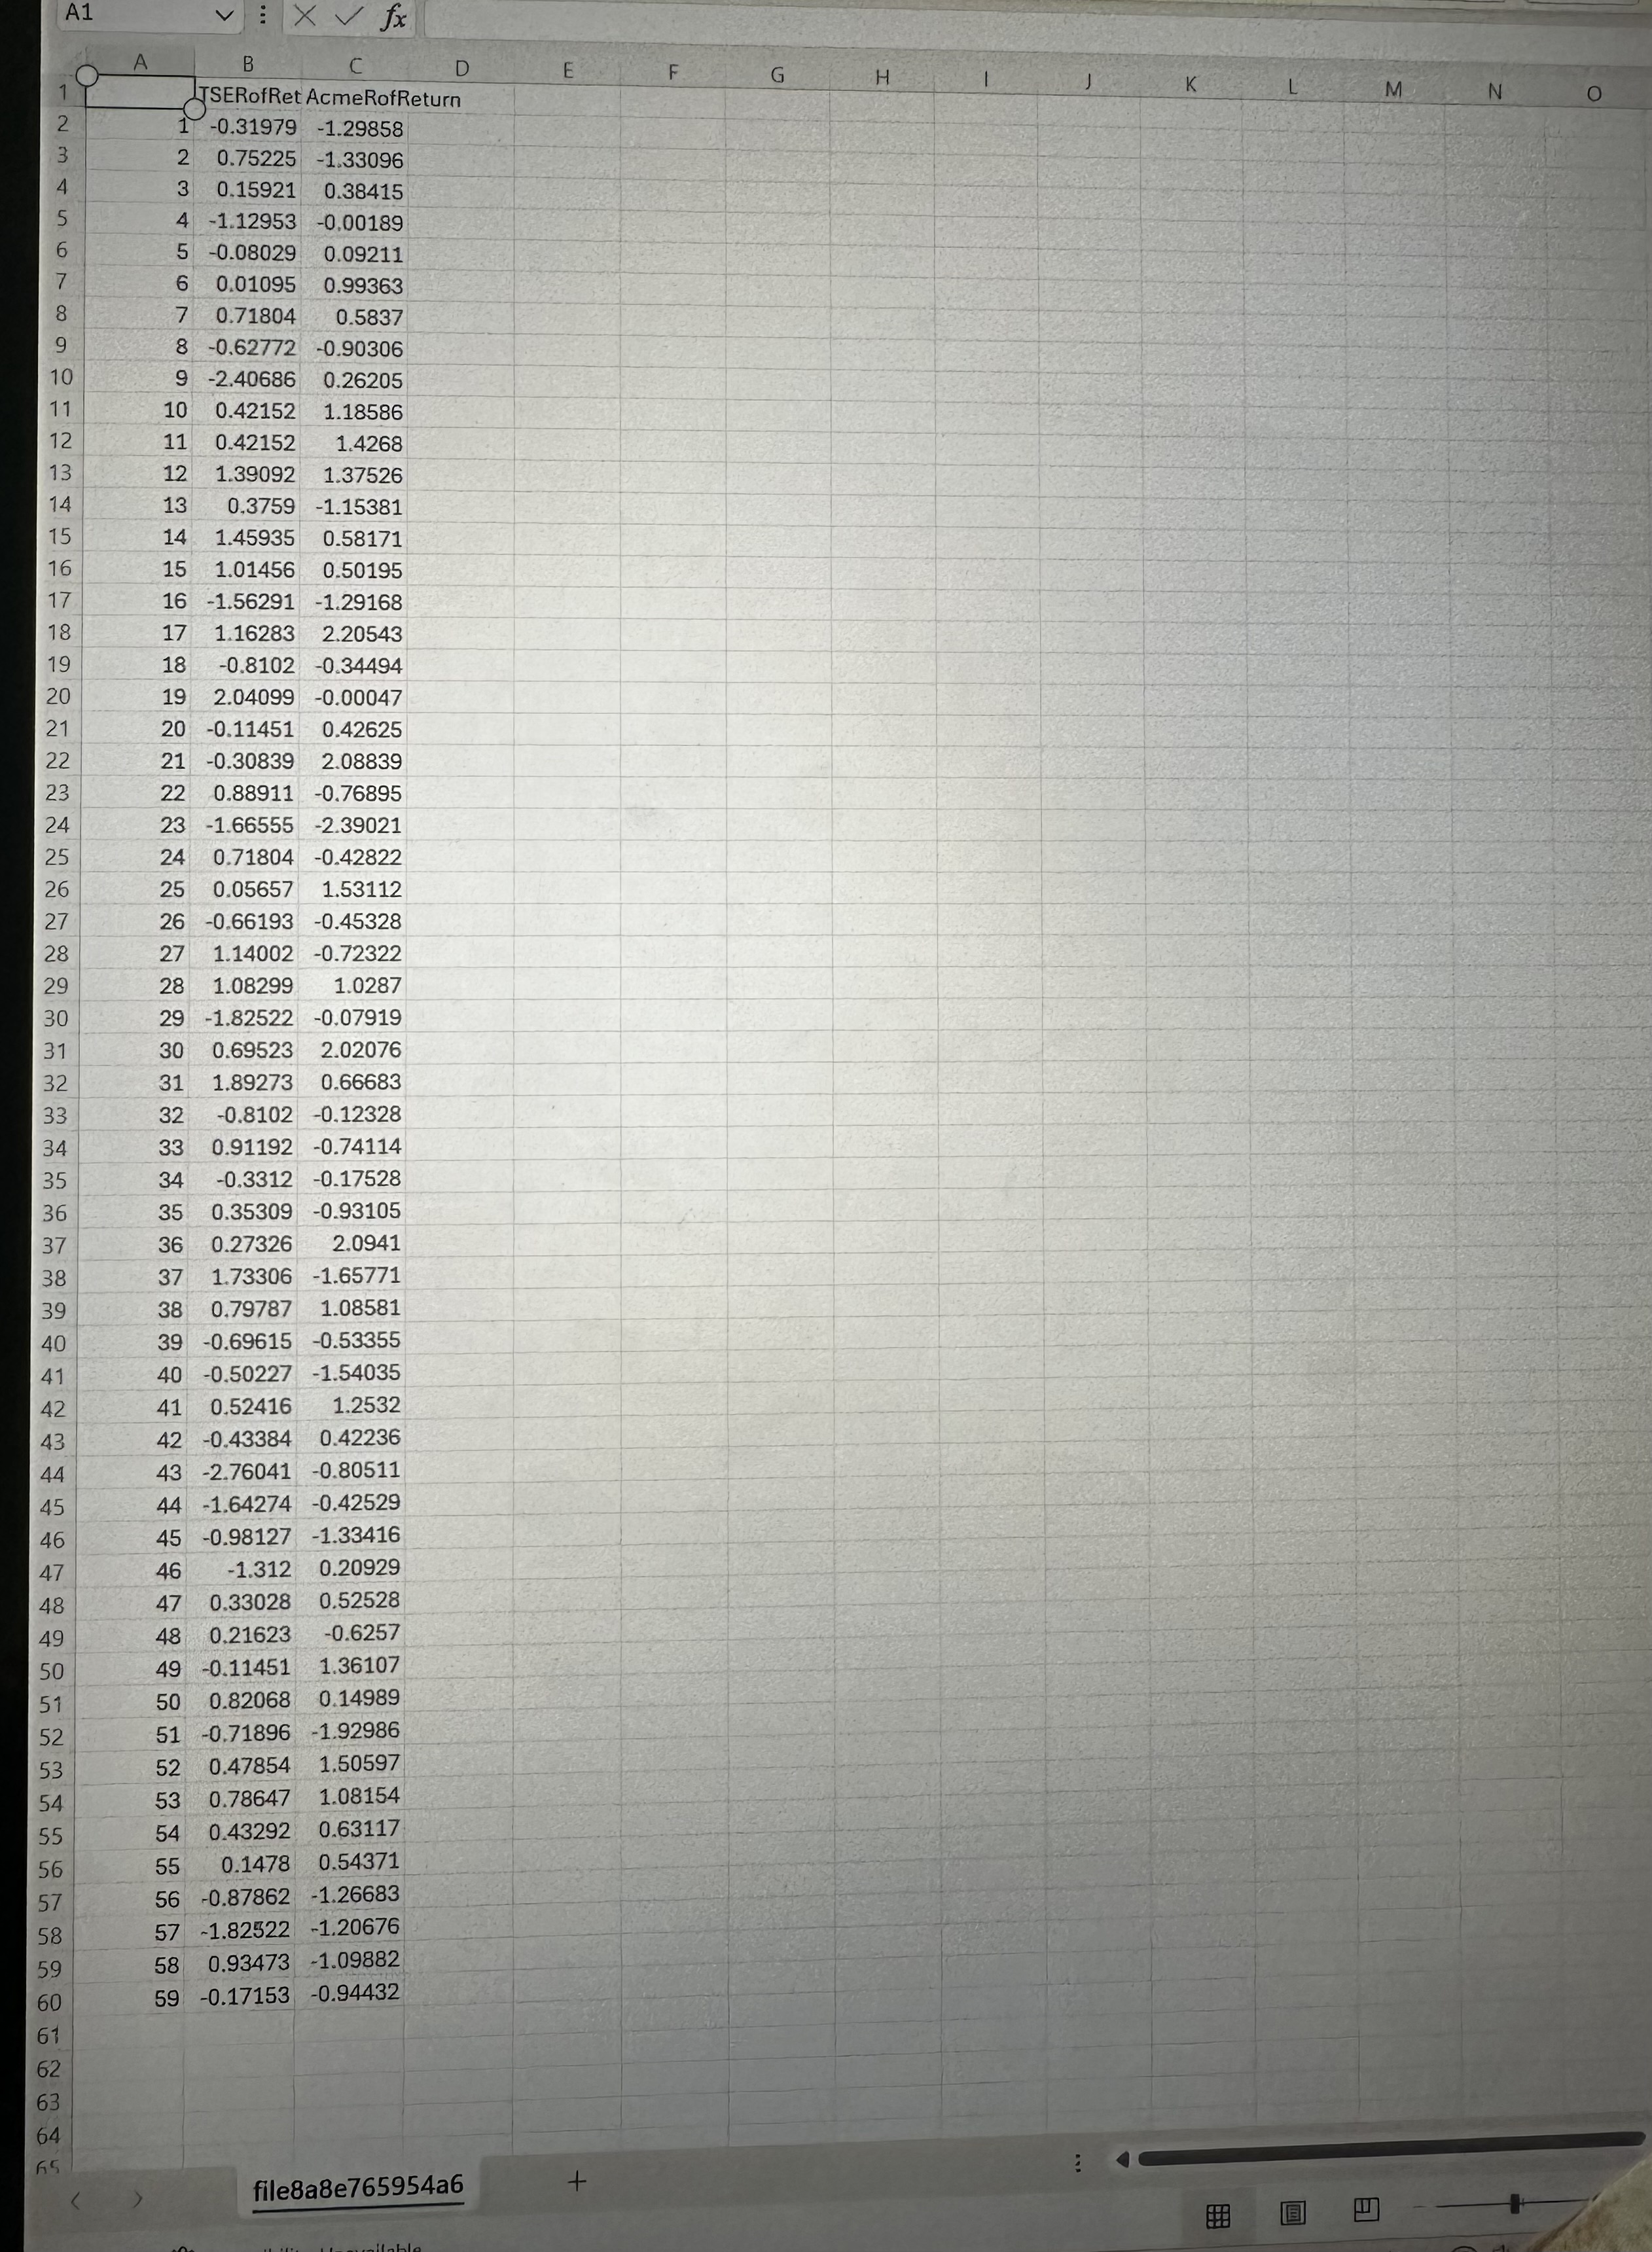
Assignment 4: Problem 3 (1 point) The Capital Asset Price Model (CAPM) is a financial model that attempts to predict the rate of return on a financial instrument, such as a common stock, in such a way that it is linearly related to the rate of return on the overal market. Specifically, RStock A,i Bo+R Market,i + ei = You are to study the relationship between the two variables and estimate the above model: R Stock A,i-rate of return on Stock A for month i, i = 1, 2,..., 59. RMarket,i-market rate of return for month i, i = 1, 2, . ...., 59. B1 represent's the stocks 'beta' value, or its systematic risk. It measure's the stocks volatility related to the market volatility. Bo represents the risk-free interest rate. The data in the .csv file contains the data on the rate of return of a large energy company which will be referred to as Acme Oil and Gas and the corresponding rate of return on the Toronto Composite Index (TSE) for 59 randomly selected months. Therefore RAcme, represents the monthly rate of return for a common share of Acme Oil and Gas stock; RTSE,i represents the monthly rate of return (increase or decrease) of the TSE Index for the same month, month i. The first column in this data file contains the monthly rate of return on Acme Oil and gas stock; the second column contains the monthly rate of return on the TSE index for the same month. (a) Use software to estimate this model. Use four-decimals in each of your least-squares estimatesyour answer. R Acme,i = + RTSE,i (b) Find the coefficient of determination. Expresses as a percentage, and use two decimal places in your answer. r2 = % (c) In the context of the data, interpret the meaning of the coefficient of determination. A. The percentage found above is the percentage of variation in the monthly rate of return of the TSE Index that can be explained by its linear dependency with the monthly rate of return of Acme stock. B. The percentage found above is the percentage of variation in the monthly rate of return of Acme stock that can be explained by its linear dependency with the monthly rate of return of the TSE Index. C. There is a strong, positive linear relationship between the monthly rate of return of Acme stock and the monthly rate of return of the TSE Index. D. There is a weak, positive linear relationship between the monthly rate of return of Acme stock and the monthly. rate of return of the TSE Index. (d) Find the standard deviation of the prediction/regression, using two decimals in your answer. Se = (e, i) You wish to test if the data collected supports the statistical model listed above. That is, can the monthly rate of return on Acme stock be expressed as a linear function of the monthly rate of return on the TSE Index? Select the correct statistical hypotheses which you are to test. A. Ho: Bo B. Ho B00 : C. Ho: 1 0 : HA BO 0 = H. Ho10 HA: 1 0 (e, ii) Use the F-test, test the statistical hypotheses determined in (e, i). Find the value of the test statistic, using three decimals in your answer. Fcalc = (e, iii) Find the P-value of your result in (e, ii). Use three decimals in your answer. P-value = (f) Using an a of 5%, this data indicates that the monthly rate of return of ? ? be expressed as a linear function of the monthly rate of return of ? (g) Find a 95% confidence interval for the slope term of the model, 1. Lower Bound = (use three decimals in your answer) Upper Bound = (use three decimals in your answer) (h) Choose the correct interpretation of the meaning of your confidence interval for 1, in the the context of the data. A. As the monthly rate of return of Acme Oil and Gas stock increases by 1%, the monthly rate of return of the TSE Index will increase, on average, by an amount that is somewhere between the lower and upper bounds found in (g). B. As the monthly rate of return of Acme Oil and Gas stock increases by 1%, the monthly rate of return of the TSE Index increases by an amount that is somewhere between the lower and upper bounds found in (g). C. As the monthly rate of return of the TSE Index increases by 1%, the monthly rate of return of Acme Oil and Gas stock increases by an amount that is somewhere between the lower and upper bounds found in (g). D. There is a statistical relationship between the monthly rate of return on Acme Oil and Gas stock and the monthly rate of return on the TSE Index. E. As the monthly rate of return of the TSE Index increases by 1%, the monthly rate of return of Acme Oil and Gas stock will increase, on average, by an amount that is between the lower and upper bounds found in (g). F. There is no statistical relationship between the monthly rate of return on Acme Oil and Gas stock and the monthly rate of return on the TSE Index. (i) Find a 95% confidence interval for the o term of the model. Lower Bound = (use three decimals in your answer) Upper Bound = (use three decimals in your answer) (j) Choose the correct interpretation of the meaning of your confidence interval for Bo, in the the context of the data. A. There is no statistical relationship between the monthly rate of return on Acme Oil and Gas stock and the monthly rate of return on the TSE Index. B. If the monthly rate of return of Acme Oil and Gas stock is 0%, the average monthly rate of return of the TSE Index will be equal to an amount that is somewhere between the lower and upper bounds found in (i). C. If the monthly rate of return of the TSE Index is 0%, the monthly rate of return of Acme Oil and Gas stock will be, on average, equal to an amount that is between the lower and upper bounds found in (i). D. If the monthly rate of return of the TSE Index is 0%, the monthly rate of return of Acme Oil and Gas stock will be equal to an amount that is between the lower and upper bounds found in (i). E. There is a statistical relationship between the monthly rate of return on Acme Oil and Gas stock and the monthly rate of return on the TSE Index. F. If the monthly rate of return of Acme Oil and Gas stock is 0%, the monthly rate of return of the TSE Index will be equal to an amount that is somewhere between the lower and upper bounds found in (i). (k) Last month, the TSE Index's monthly rate of return was 1.5%. This is, at the end of last month the value of the TSE Index was 1.5% higher than at the beginning of last month. With 95% confidence, find the last month's rate of return on Acme Oil and Gas stock. Lower Bound = (use three decimals in your answer) Upper Bound = (use three decimals in your answer) A1 VXV fx Xfx A B C D E F G H J K TSERofRet Acme RofReturn L M N 2 1 -0.31979 -1.29858 3 2 0.75225 -1.33096 4 3 0.15921 0.38415 5 4 -1.12953 -0.00189 6 5 -0.08029 0.09211 7 6 0.01095 0.99363 8 7 0.71804 0.5837 9 8 -0.62772 -0.90306 10 9 -2.40686 0.26205 11 10 0.42152 1.18586 12 11 0.42152 1.4268 13 12 1.39092 1.37526 14 13 0.3759 -1.15381 15 16 14 1.45935 0.58171 15 1.01456 0.50195 17 16 -1.56291 -1.29168 18 17 1.16283 2.20543 19 18 -0.8102 -0.34494 20 19 2.04099 -0.00047 21 20 -0.11451 0.42625 22 23 21 -0.30839 2.08839 22 0.88911 -0.76895 24 23 -1.66555 -2.39021 25 24 0.71804 -0.42822 26 25 0.05657 1.53112 27 26 -0.66193 -0.45328 28 27 1.14002 -0.72322 29 28 1.08299 1.0287 30 29 -1.82522 -0.07919 31 32 30 0.69523 2.02076 31 1.89273 0.66683 33 32 -0.8102 -0.12328 34 33 0.91192 -0.74114 35 34 -0.3312 -0.17528 36 35 0.35309 -0.93105 37 36 0.27326 2.0941 38 37 1.73306 -1.65771 39 38 0.79787 1.08581 40 39 -0.69615 -0.53355 41 40 -0.50227 -1.54035 42 41 0.52416 1.2532 43 42 -0.43384 0.42236 44 43 -2.76041 -0.80511 45 44 -1.64274 -0.42529 46 45 -0.98127 -1.33416 47 46 -1.312 0.20929 48 47 0.33028 0.52528 49 48 0.21623 -0.6257 50 49 -0.11451 1.36107 51 50 0.82068 0.14989 52 51 -0.71896 -1.92986 53 52 0.47854 1.50597 54 53 0.78647 1.08154 55 54 0.43292 0.63117 56 55 0.1478 0.54371 57 56 -0.87862 -1.26683 58 57 -1.82522 -1.20676 59 58 0.93473 -1.09882 60 59 -0.17153 -0.94432 61 62 63 64 65 file8a8e765954a6 vallable +
Step by Step Solution
There are 3 Steps involved in it
Step: 1

Get Instant Access to Expert-Tailored Solutions
See step-by-step solutions with expert insights and AI powered tools for academic success
Step: 2

Step: 3
Ace Your Homework with AI
Get the answers you need in no time with our AI-driven, step-by-step assistance
Get Started
Principles Of Managerial Finance
Authors: Lawrence J. Gitman, Chad J. Zutter
13th Edition
9780132738729, 136119468, 132738724, 978-0136119463