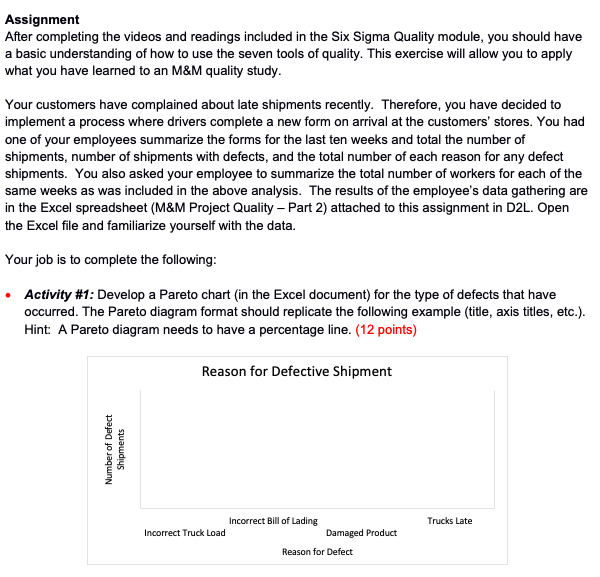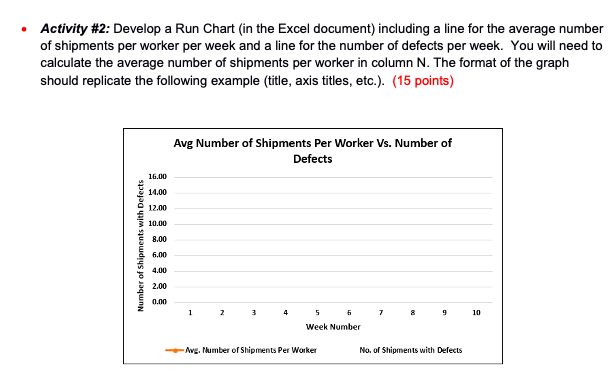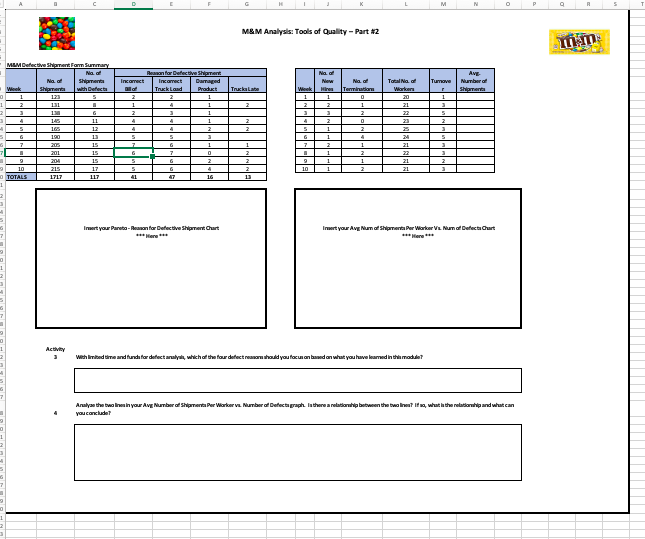


Assignment After completing the videos and readings included in the Six Sigma Quality module, you should have a basic understanding of how to use the seven tools of quality. This exercise will allow you to apply what you have learned to an M&M quality study. Your customers have complained about late shipments recently. Therefore, you have decided to implement a process where drivers complete a new form on arrival at the customers' stores. You had one of your employees summarize the forms for the last ten weeks and total the number of shipments, number of shipments with defects, and the total number of each reason for any defect shipments. You also asked your employee to summarize the total number of workers for each of the same weeks as was included in the above analysis. The results of the employee's data gathering are in the Excel spreadsheet (M&M Project Quality - Part 2) attached to this assignment in D2L. Open the Excel file and familiarize yourself with the data. Your job is to complete the following: Activity #1: Develop a Pareto chart (in the Excel document) for the type of defects that have occurred. The Pareto diagram format should replicate the following example (title, axis titles, etc.). Hint A Pareto diagram needs to have a percentage line. (12 points) Reason for Defective Shipment Number of Defect Shipments Trucks Late Incorrect Truck Load Incorrect Bill of Lading Damaged Product Reason for Defect Activity #2: Develop a Run Chart (in the Excel document) including a line for the average number of shipments per worker per week and a line for the number of defects per week. You will need to calculate the average number of shipments per worker in column N. The format of the graph should replicate the following example (title, axis titles, etc.). (15 points) Avg Number of Shipments Per Worker Vs. Number of Defects 16.00 14.00 12.00 10.00 8.00 Number of shipments with Defects 6.00 4.00 2.00 0.00 1 2 3 4 5 5 7 8 10 Week Number Avg. Number of Shipments Per Worker No. of Shipments with Delects K M M&M Analysis: Tools of Quality - Part 2 mm Income Ron for Detective Shoot Income Dared Truck Land Produkt Na od New Hin Tumave Ave Number Share Truskal Total No. of Workers 20 21 Wick 1 2 2 1 Na o Ten 0 1 2 O 2 MLM Detective Shemary Na o Na Shar with Delecta 1 1 2 131 2 13 11 S 1 12 190 13 G som 15 9 2013 15 10 215 17 TOTALS 17L7 117 3 3 2 2 1 S 7 G 21 O 1 1 1 10 21 IG Imert your Pareto-Reason for Detective Shipment Chart Imert your AveNum Shipments Per Worker Vu Num Detect Chart Activity 3 with limited time and fund for detectarul, which of the four defect reason should you focus on based on what you have learned in the module Analyse the weinyour Av Number of Shipments Per Worker Number of Delectupraph lathere a relationship between the two linest, what the relationship and what can you conclude Assignment After completing the videos and readings included in the Six Sigma Quality module, you should have a basic understanding of how to use the seven tools of quality. This exercise will allow you to apply what you have learned to an M&M quality study. Your customers have complained about late shipments recently. Therefore, you have decided to implement a process where drivers complete a new form on arrival at the customers' stores. You had one of your employees summarize the forms for the last ten weeks and total the number of shipments, number of shipments with defects, and the total number of each reason for any defect shipments. You also asked your employee to summarize the total number of workers for each of the same weeks as was included in the above analysis. The results of the employee's data gathering are in the Excel spreadsheet (M&M Project Quality - Part 2) attached to this assignment in D2L. Open the Excel file and familiarize yourself with the data. Your job is to complete the following: Activity #1: Develop a Pareto chart (in the Excel document) for the type of defects that have occurred. The Pareto diagram format should replicate the following example (title, axis titles, etc.). Hint A Pareto diagram needs to have a percentage line. (12 points) Reason for Defective Shipment Number of Defect Shipments Trucks Late Incorrect Truck Load Incorrect Bill of Lading Damaged Product Reason for Defect Activity #2: Develop a Run Chart (in the Excel document) including a line for the average number of shipments per worker per week and a line for the number of defects per week. You will need to calculate the average number of shipments per worker in column N. The format of the graph should replicate the following example (title, axis titles, etc.). (15 points) Avg Number of Shipments Per Worker Vs. Number of Defects 16.00 14.00 12.00 10.00 8.00 Number of shipments with Defects 6.00 4.00 2.00 0.00 1 2 3 4 5 5 7 8 10 Week Number Avg. Number of Shipments Per Worker No. of Shipments with Delects K M M&M Analysis: Tools of Quality - Part 2 mm Income Ron for Detective Shoot Income Dared Truck Land Produkt Na od New Hin Tumave Ave Number Share Truskal Total No. of Workers 20 21 Wick 1 2 2 1 Na o Ten 0 1 2 O 2 MLM Detective Shemary Na o Na Shar with Delecta 1 1 2 131 2 13 11 S 1 12 190 13 G som 15 9 2013 15 10 215 17 TOTALS 17L7 117 3 3 2 2 1 S 7 G 21 O 1 1 1 10 21 IG Imert your Pareto-Reason for Detective Shipment Chart Imert your AveNum Shipments Per Worker Vu Num Detect Chart Activity 3 with limited time and fund for detectarul, which of the four defect reason should you focus on based on what you have learned in the module Analyse the weinyour Av Number of Shipments Per Worker Number of Delectupraph lathere a relationship between the two linest, what the relationship and what can you conclude


