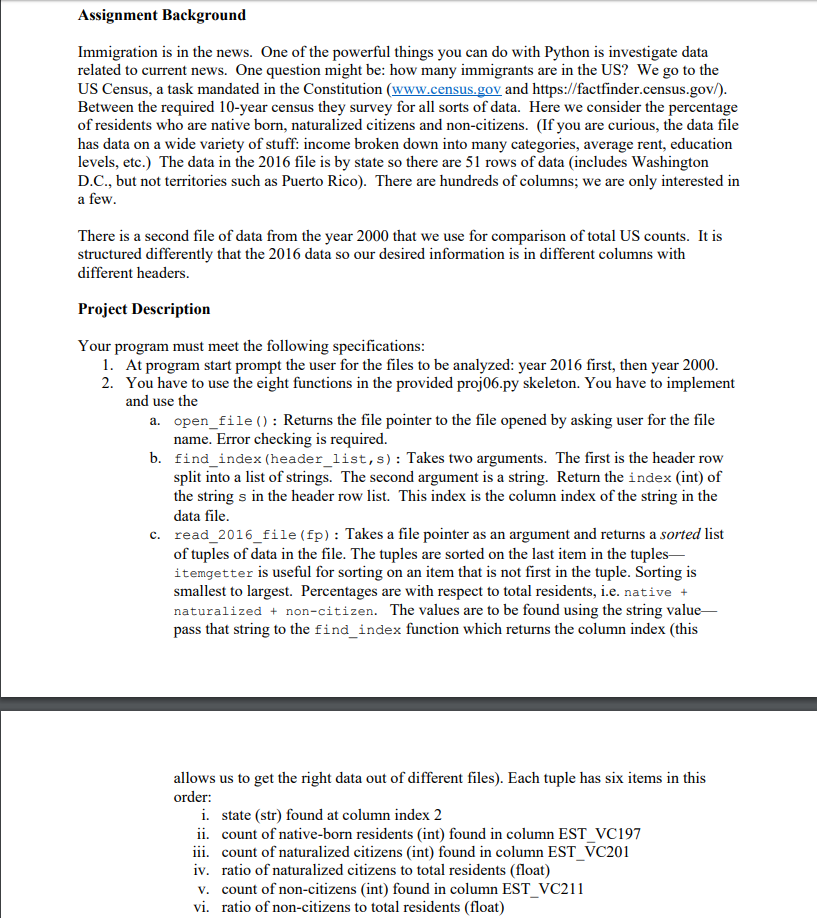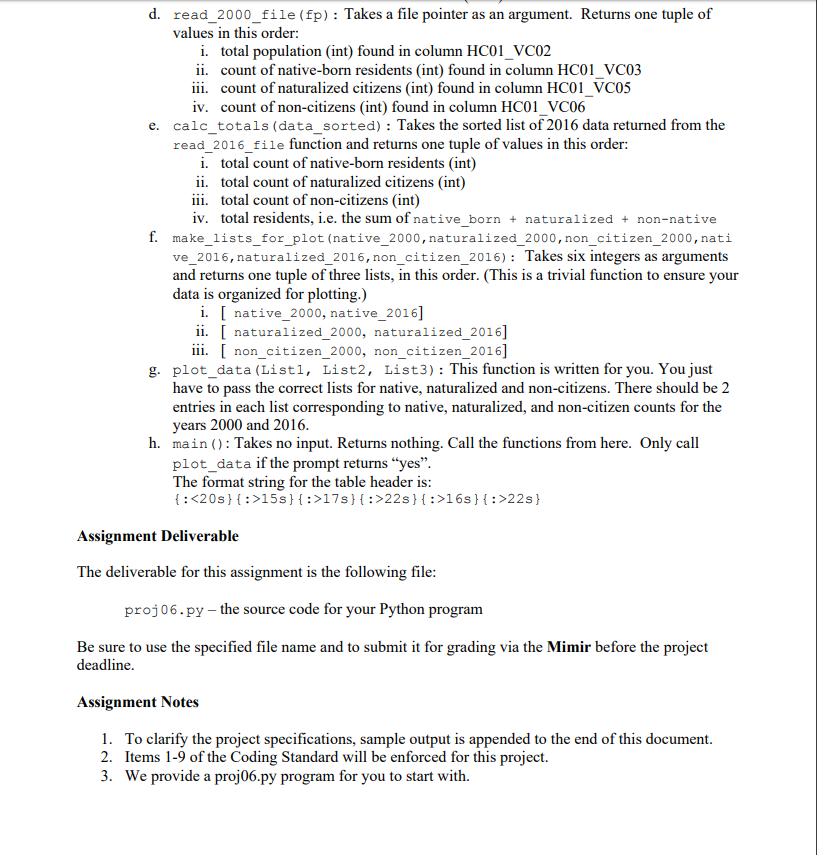

Assignment Background Immigration is in the news. One of the powerful things you can do with Python is investigate data related to current news. One question might be: how many immigrants are in the US? We go to the US Census, a task mandated in the Constitution (www.census.gov and https://factfinder.census.gov/) Between the required 10-year census they survey for all sorts of data. Here we consider the percentage of residents who are native born, naturalized citizens and non-citizens. (If you are curious, the data file has data on a wide variety of stuff: income broken down into many categories, average rent, education levels, etc.) The data in the 2016 file is by state so there are 51 rows of data (includes Washington D.C., but not territories such as Puerto Rico). There are hundreds of columns; we are only interested in a few There is a second file of data from the year 2000 that we use for comparison of total US counts. It is structured differently that the 2016 data so our desired information is in different columns with different headers. Project Description Your program must meet the following specifications 1. 2. At program start prompt the user for the files to be analyzed: year 2016 first, then year 2000 You have to use the eight functions in the provided proj06.py skeleton. You have to implement and use the a. open file): Returns the file pointer to the file opened by asking user for the file name. Error checking is required. b. find index (header_list,s): Takes two arguments. The first is the header row split into a list of strings. The second argument is a string. Return the index (int) of the string s in the header row list. This index is the column index of the string in the data file c. read 2016 file (fp): Takes a file pointer as an argument and returns a sorted list of tuples of data in the file. The tuples are sorted on the last item in the tuples- itemgetter is useful for sorting on an item that is not first in the tuple. Sorting is smallest to largest. Percentages are with respect to total residents, i.e. native naturalized non-citizen. The values are to be found using the string value_ pass that string to the find index function which returns the column index (this allows us to get the right data out of different files). Each tuple has six items in this order. i. state (str) found at column index 2 ii. count of native-born residents (int) found in column EST VC197 iii. count of naturalized citizens (int) found in column EST VC201 iv. ratio of naturalized citizens to total residents (float) v. count of non-citizens (int) found in column EST_VC211 vi. ratio of non-citizens to total residents (float) Assignment Background Immigration is in the news. One of the powerful things you can do with Python is investigate data related to current news. One question might be: how many immigrants are in the US? We go to the US Census, a task mandated in the Constitution (www.census.gov and https://factfinder.census.gov/) Between the required 10-year census they survey for all sorts of data. Here we consider the percentage of residents who are native born, naturalized citizens and non-citizens. (If you are curious, the data file has data on a wide variety of stuff: income broken down into many categories, average rent, education levels, etc.) The data in the 2016 file is by state so there are 51 rows of data (includes Washington D.C., but not territories such as Puerto Rico). There are hundreds of columns; we are only interested in a few There is a second file of data from the year 2000 that we use for comparison of total US counts. It is structured differently that the 2016 data so our desired information is in different columns with different headers. Project Description Your program must meet the following specifications 1. 2. At program start prompt the user for the files to be analyzed: year 2016 first, then year 2000 You have to use the eight functions in the provided proj06.py skeleton. You have to implement and use the a. open file): Returns the file pointer to the file opened by asking user for the file name. Error checking is required. b. find index (header_list,s): Takes two arguments. The first is the header row split into a list of strings. The second argument is a string. Return the index (int) of the string s in the header row list. This index is the column index of the string in the data file c. read 2016 file (fp): Takes a file pointer as an argument and returns a sorted list of tuples of data in the file. The tuples are sorted on the last item in the tuples- itemgetter is useful for sorting on an item that is not first in the tuple. Sorting is smallest to largest. Percentages are with respect to total residents, i.e. native naturalized non-citizen. The values are to be found using the string value_ pass that string to the find index function which returns the column index (this allows us to get the right data out of different files). Each tuple has six items in this order. i. state (str) found at column index 2 ii. count of native-born residents (int) found in column EST VC197 iii. count of naturalized citizens (int) found in column EST VC201 iv. ratio of naturalized citizens to total residents (float) v. count of non-citizens (int) found in column EST_VC211 vi. ratio of non-citizens to total residents (float)


