Answered step by step
Verified Expert Solution
Question
1 Approved Answer
Assignment Data Manipulation: Download the dataset below for burrito reviews in California and complete the following tasks: Create a histogram or bar chart of what

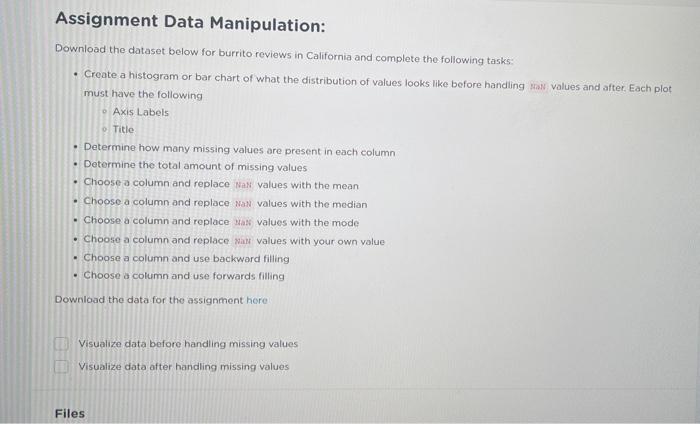
Assignment Data Manipulation:
Download the dataset below for burrito reviews in California and complete the following tasks:
Create a histogram or bar chart of what the distribution of values looks like before handling NaN values and after. Each plot must have the following
Axis Labels
Title
Determine how many missing values are present in each column
Determine the total amount of missing values
Choose a column and replace NaN values with the mean
Choose a column and replace NaN values with the median
Choose a column and replace NaN values with the mode
Choose a column and replace NaN values with your own value
Choose a column and use backward filling
Choose a column and use forwards filling
Download the data for the assignment here
Visualize data before handling missing values
Visualize data after handling missing values
Step by Step Solution
There are 3 Steps involved in it
Step: 1

Get Instant Access to Expert-Tailored Solutions
See step-by-step solutions with expert insights and AI powered tools for academic success
Step: 2

Step: 3

Ace Your Homework with AI
Get the answers you need in no time with our AI-driven, step-by-step assistance
Get Started


