

Question
Assignment: Excel Pivot Table ( 1 5 0 points) Read the brief case below. Using the Excel spreadsheet provided, complete the questions. Atlas Bikes Atlas
Assignment: Excel Pivot Table (150 points)
Read the brief case below. Using the Excel spreadsheet provided, complete the questions.
Atlas Bikes
Atlas Bikes has been selling their bikes since 1975 in the United States. They expanded to Australia and Germany in the year 2015. The bikes are sold via a trusted network of sales outlets, which are not owned by Atlas Bikes. As a measure to improve their footprint in the market, Atlas sales wants to open new stores which will be owned by them. To do this, the Senior Management wants to review the numbers and come up with their expansion strategy.
Instructions: In the excle spreadheet provided, complete the tasks below. Upon completion you will submit a single, completed, Excel workbook.
Answer the six (6) questions below. 25 points each
1. Use the data in the sheet titled Main to calculate the total sales for US, Germany and Australia. What were the numbers recorded by United States in 2016
a. Create a new worksheet titled Q1_Total_Sales and insert a new pivot table for the data in the sheet Main
b. List the total sales for all the 3 countries in this table
c. The names of the countries show feature in the 1stcolumn
d. Split the dollar sales year wise. Format the numbers to reflect the $ symbol before the figures
2. The Management would like to know the split of the revenue figures logged by the Sales Outlets for 2015 and 2016. In the same sheet, display the same numbers as percentages of the total sales logged country-wise for a specific year. The management wants to know all the stores that logged less than 25% of the sales, country-wise for 2015 and 2016. Which store has logged sales less than 25% for both the years?
a. Create a new worksheet titled Q2_Outlets_Revenues and insert a new pivot table for the data in the sheet Main
b. In the first column, list the countries first and then the Sales Outlets under them.
c. Repeat Step a. and insert another pivot table in the sheet - Question 2 - Outlets' Revenues.
d. Display the revenues for the second pivot table as % of Parent Row Total
e. Use conditional formatting to highlight the cells that are below 25%
3. June happens to be the busiest month in terms of the sales. For the year 2016, which are the top 5 products that they sold? What was the quantity sold for the number one product?
a. Create a new worksheet titled Q3_Bestsellers and insert a new pivot table for the data in the sheet Main
b. Add a filter for the year
c. List all the products in the 1st column
d. Filter out all the months except for June
e. Sort the quantity in Descending order
f. Use conditional formatting to highlight the cells for the Top 5 products
4. Management would like to know how much revenue was contributed by each of the distribution channels. Drill down to the Product Categories. They want to use a slicer to filter the data, rather than an actual filter which is more cumbersome, for filtering the data country and year wise. What were the Internet Sales for United States for 2015?
a. Create a new worksheet titled Q4_Channelwise_Sales and insert a new pivot table for the data in the sheet Main
b. The Distribution Channel and the Product Categories should be listed in the 1st column
c. Insert the Revenue twice, once for the numbers and secondly for the representation in percentages
d. Insert a Slicer on Country and Year. Arrange the slicers in an appealing way.
5. Management would like to know what is the split in terms of quantity, across the Product Categories, for each country for the year 2015 and 2016. Use a Line Chart to show the numbers. Rank the Countries in terms of quantity sold.
a. Create a new worksheet titled Q5_Quantity_Sold and insert a new pivot table for the data in the sheet Main
b. List all the Product Categories in the 1st column.
c. Split the Quantity across the countries [ Hint: Drag the field Country in the Column Label area
d. Select the Pivot Table and Click on Options> Pivot Chart
e. Insert a Line Chart of your choice
6. As the Sr. Data Analyst, you want to shorten the process of creating a particular Pivot table about the Quantities sold across the Product Categories, split by the countries. Create a Macro to perform this operation for you on the fly.Insert a button to run this macro
a. Create a new worksheet titled Q6_Macro and insert a new pivot table for the data in the sheet Main
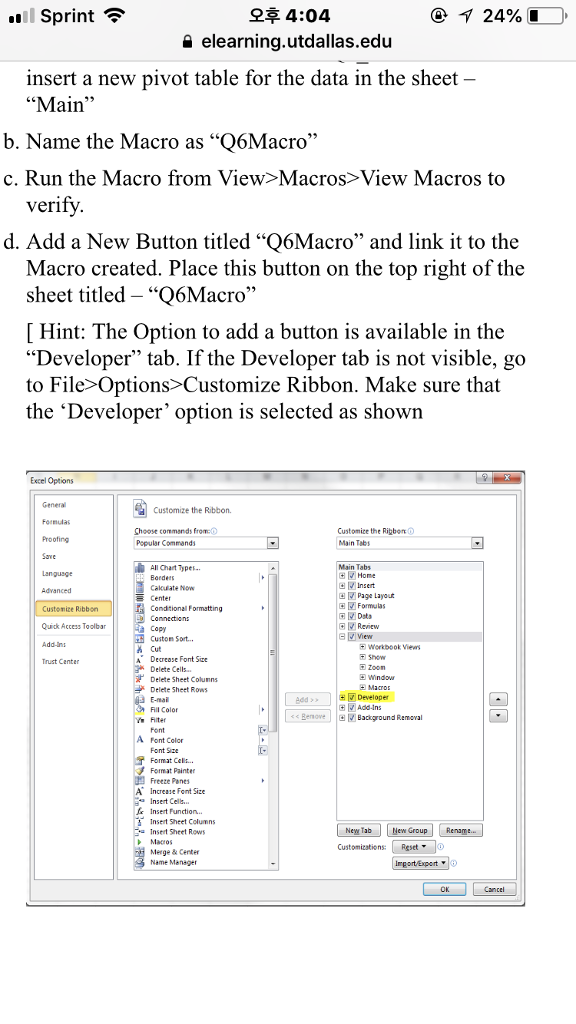
b. Name the Macro as Q6Macro
c. Run the Macro from View>Macros>View Macros to verify.
d. Add a New Button titled Q6Macro and link it to the Macro created. Place this button on the top right of the sheet titled Q6Macro
[ Hint: The Option to add a button is available in the Developer tab. If the Developer tab is not visible, goto File>Options>Customize Ribbon. Make sure that the Developer option is selected as shown
?? 4:04 elearning.utdallas.edu Sprint insert a new pivot table for the data in the sheet "Main b. Name the Macro as "Q6Macro" c. Run the Macro from View>Macros> View Macros to verify d. Add a New Button titled "Q6Macro" and link it to the Macro created. Place this button on the top right of the sheet titled - "Q6Macro" [Hint: The Option to add a button is available in the "Developer" tab. If the Developer tab is not visible, go to File> Options>Customize Ribbon. Make sure that the 'Developer' option is selected as shown Excel Options General Formulas Proofing Save Langusge Customize the Ribbon. Choose commands from Popular Commands Customice the Ribbon Main Tab Main Tabs All Chart Typer Borders Calouate Now Center Condtional Formatting Home Page Layout Data insert Formulas Customize Ribbon Quick Access Toolbar Renew View H workbook Views Copy Custom Sort... k Cut Decrease Font Sice Delete Cells Delete Sheet Columns Trust Center Zoon Windo Add > > H Developer Fil Color hiter font Macros> View Macros to verify d. Add a New Button titled "Q6Macro" and link it to the Macro created. Place this button on the top right of the sheet titled - "Q6Macro" [Hint: The Option to add a button is available in the "Developer" tab. If the Developer tab is not visible, go to File> Options>Customize Ribbon. Make sure that the 'Developer' option is selected as shown Excel Options General Formulas Proofing Save Langusge Customize the Ribbon. Choose commands from Popular Commands Customice the Ribbon Main Tab Main Tabs All Chart Typer Borders Calouate Now Center Condtional Formatting Home Page Layout Data insert Formulas Customize Ribbon Quick Access Toolbar Renew View H workbook Views Copy Custom Sort... k Cut Decrease Font Sice Delete Cells Delete Sheet Columns Trust Center Zoon Windo Add > > H Developer Fil Color hiter font
Step by Step Solution
There are 3 Steps involved in it
Step: 1

Get Instant Access to Expert-Tailored Solutions
See step-by-step solutions with expert insights and AI powered tools for academic success
Step: 2

Step: 3
Ace Your Homework with AI
Get the answers you need in no time with our AI-driven, step-by-step assistance
Get Started
Flash XML Applications Use AS2 And AS3 To Create Photo Galleries Menus And Databases
Authors: Joachim Schnier
1st Edition
0240809173, 978-0240809175