Assignment: In this assignment, we will look at the real data from the H 1N1 2009 flu pandemic showing the cumulative deaths in Europe, weeks
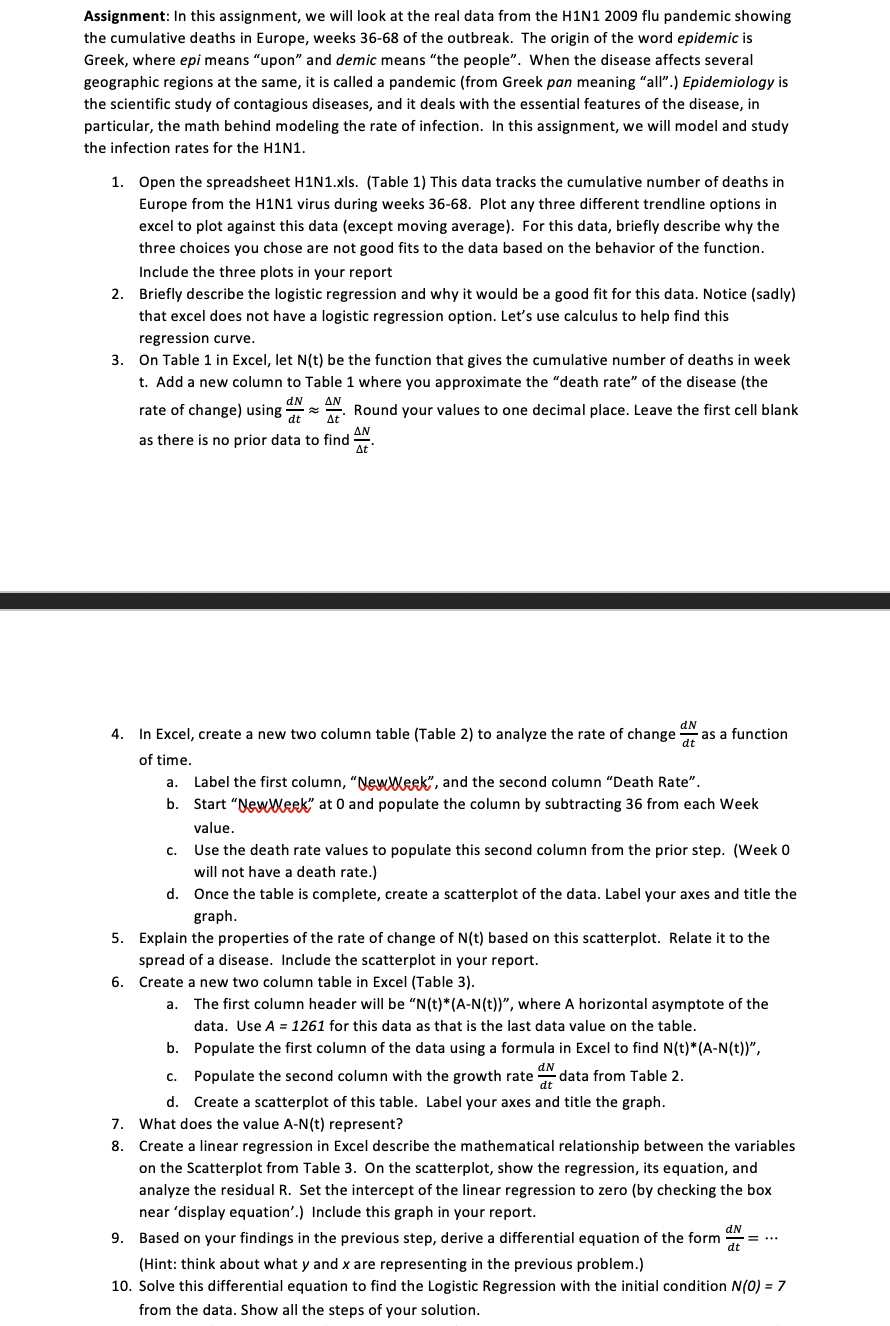
Assignment: In this assignment, we will look at the real data from the H 1N1 2009 flu pandemic showing the cumulative deaths in Europe, weeks 36-68 of the outbreak. The origin of the word epidemic is Greek, where epr' means "upon\" and demic means "the people\". When the disease affects several geographic regions at the same, it is called a pandemic (from Greek pan meaning "all\".j Epidemiology is the scientic study of contagious diseases, and it deals with the essential features of the disease, in particular, the math behind modeling the rate of infection. In this assignment, we will model and study the infection rates for the H1N1. 1. 4. 5. 10. Open the spreadsheet H1N1.xls. {Table 1} This data tracks the cumulative number ofdeaths in Europe from the H1N1 virus during weeks 36-68. Plot any three different trendline options in excel to piot against this data {except moving average). For this data, briefly describe why the three choices you chose are not good fits to the data based on the behavior of the function. Include the three plots in your report Briefly describe the logistic regression and why it would be a good fit for this data. Notice (sadly) that excel does not have a iogistic regression option. Let's use calculus to help find this regression curve. 0n Tabie 1 in Excel, let N{t} be the function that gives the cumuiative number of deaths in week t. Add a new column to Table 1 where you approximate the "death rate" of the disease {the div AN rate of change] using E z 3' Round your vaiues to one decimal place. Leave the first cell blank . . my as there Is no prior data to find E' In Excel, create a new two column table (Table 2) to analyze the rate of change % as a function of time. a. Label the first column, "W, and the second column l'I'Jeath Rate\". b. Start "W at D and populate the column by subtracting 36 from each Week value. c. Use the death rate vaiues to populate this second coiumn from the prior step. (Week 0 wiii not have a death rate.] d. Once the table is complete, create a scatterp lot of the data. Label your axes and title the graph. Explain the properties of the rate of change of N(tl based on this scatterplot. Relate it to the spread of a disease. Include the scatterpiot in your report. Create a new two column table in Excei (Table 3]. a. The first coiurnn header will be "N (t)'(A-N(t))", where A horizontal asymptote of the data. Use A = 126.1 for this data as that is the last data value on the table. b. Populate the rst column of the data using a formula in Excei to find N{t}*(A-N{t}}", c. Populate the second column with the growth rate data from Table 2. d. Create a scatte rpiot of this table. Label your axes and title the graph. What does the vaiue A-Nm represent? Create a iinear regression in Excel describe the mathematical relationship between the variables on the Scatterplot from Table 3. On the scatterplot, show the regression, its equation, and analyze the residual R. Set the intercept of the linear regression to zero {by checking the box near 'display equation'.) Include this graph in your report. Based on your findings in the previous step, derive a differential equation of the form IzN (Hint: think about what 3; and x are representing in the previous problem.) Solve this differential equation to find the Logistic Regression with the initial condition Nf} = 7 from the data. Show all the steps of your solution
Step by Step Solution
There are 3 Steps involved in it
Step: 1
Get Instant Access to Expert-Tailored Solutions
See step-by-step solutions with expert insights and AI powered tools for academic success
Step: 2
Step: 3
Ace Your Homework with AI
Get the answers you need in no time with our AI-driven, step-by-step assistance