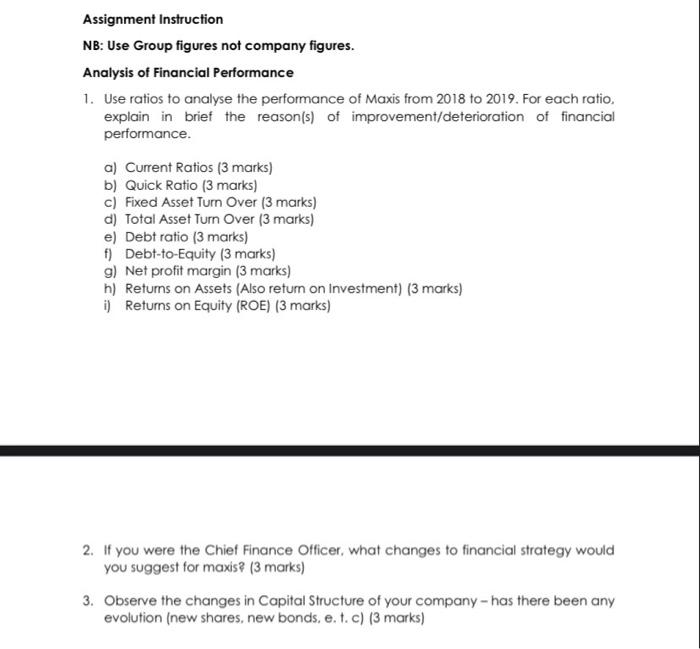
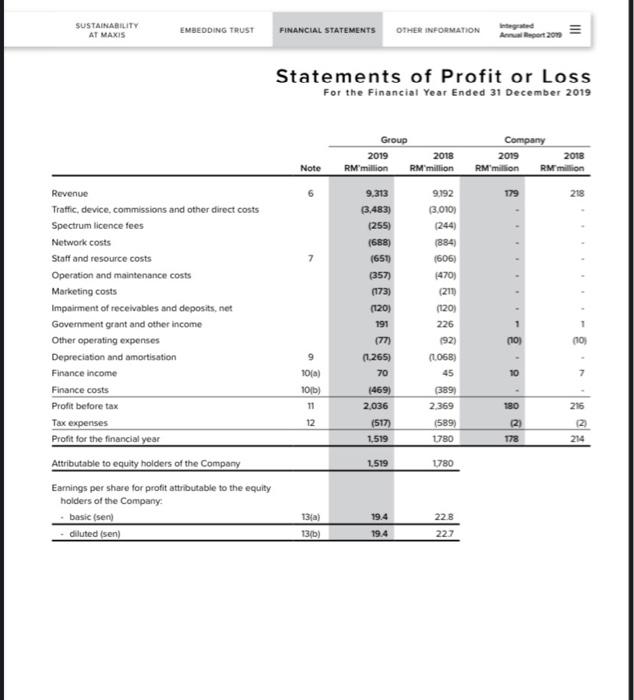
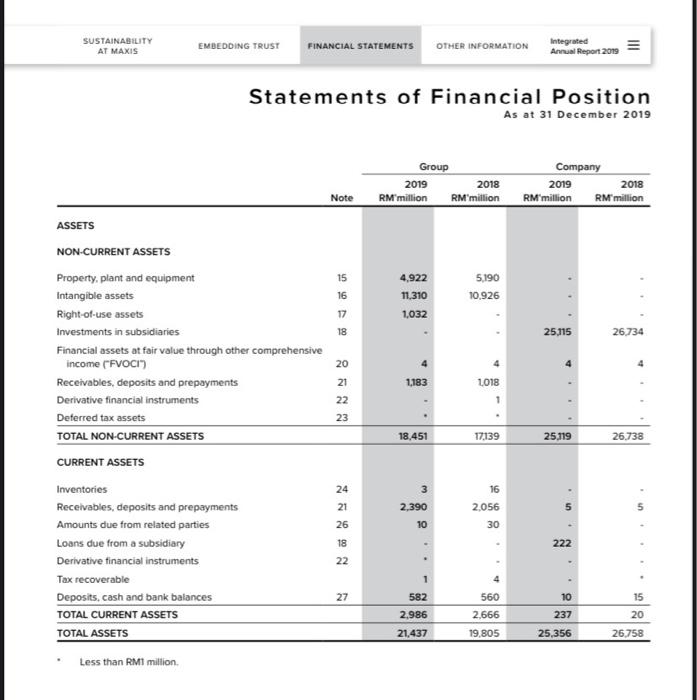
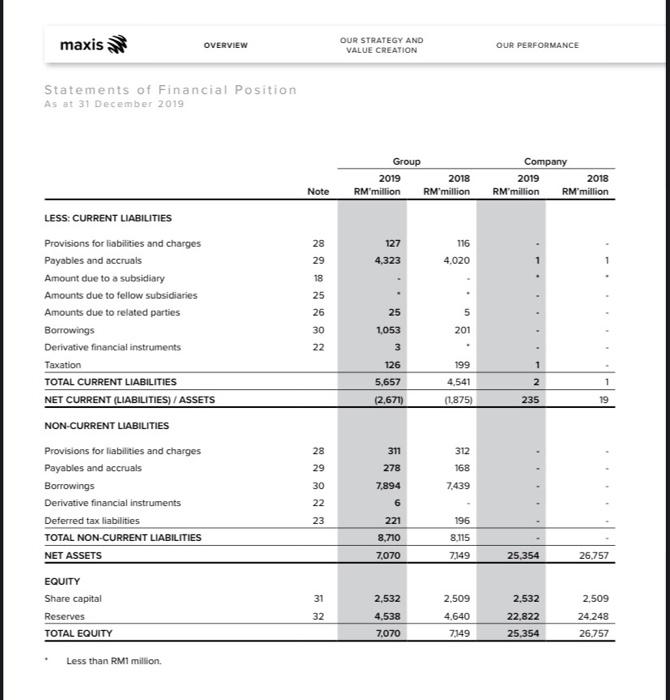
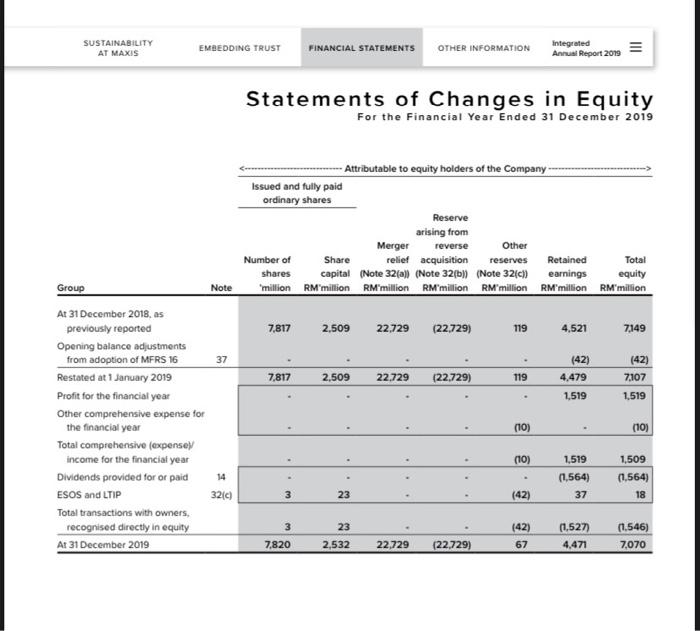
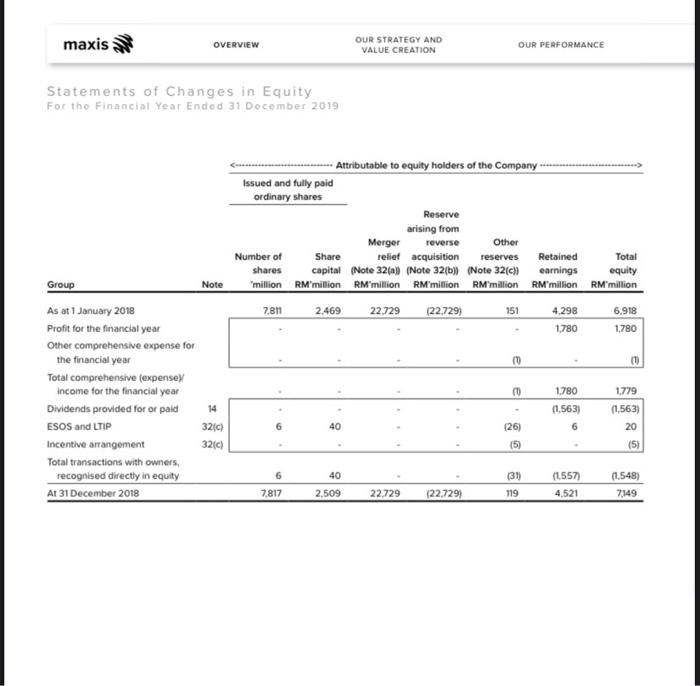
Assignment Instruction NB: Use Group figures not company figures. Analysis of Financial Performance 1. Use ratios to analyse the performance of Maxis from 2018 to 2019. For each ratio. explain in brief the reason(s) of improvement/deterioration of financial performance. a) Current Ratios (3 marks) b) Quick Ratio (3 marks) c) Fixed Asset Turn Over (3 marks) d) Total Asset Turn Over (3 marks) e) Debt ratio (3 marks) f) Debt-to-Equity (3 marks) g) Net profit margin (3 marks) h) Returns on Assets (Also return on Investment) (3 marks) i) Returns on Equity (ROE) (3 marks) 2. If you were the Chief Finance Officer, what changes to financial strategy would you suggest for maxis (3 marks) 3. Observe the changes in Capital Structure of your company - has there been any evolution (new shares, new bonds, e. t. c) (3 marks) SUSTAINABILITY AT MAXIS EMBEDDING TRUST FINANCIAL STATEMENTS OTHER INFORMATION III A Report 2013 Statements of Profit or Loss For the Financial Year Ended 31 December 2019 Group 2019 2018 RM'million RM million Company 2019 2018 RM"million RM million Note 179 218 9,313 (3.483) (255) (688) (651 (357) (173) (120) 191 9.192 (3,010) (244) (884 (606) (470) (211) (120) 226 192) (1068) 45 389 2.369 (589) 1780 (10) Revenue Traffic, device. commissions and other direct costs Spectrum licence fees Network costs Staff and resource costs Operation and maintenance costs Marketing costs Impairment of receivables and deposits.net Government grant and other income Other operating expenses Depreciation and amortisation Finance income Finance costs Profit before tax Tax expenses Profit for the financial year Attributable to equity holders of the Company Earnings per share for profit attributable to the equity holders of the Company basic (sen diluted (sen) 110 10 7 10(a) 10b) 11 12 (1.265) 70 (469) 2.036 (517) 1.519 180 215 178 214 1,519 1780 13(a) 13/6) 19.4 19.4 228 227 SUSTAINABILITY AT MAXIS EMBEDDING TRUST FINANCIAL STATEMENTS OTHER INFORMATION Integrated Annual Report 2019 Statements of Financial Position As at 31 December 2019 Group 2019 2018 RM million RM'million Company 2019 2018 RM million RM million Note ASSETS 15 4,922 11.310 1,032 5,190 10,926 16 17 18 25,115 26,734 20 21 1,183 1,018 22 23 NON-CURRENT ASSETS Property, plant and equipment Intangible assets Right-of-use assets Investments in subsidiaries Financial assets at fair value through other comprehensive income (FVOCI") Receivables, deposits and prepayments Derivative financial instruments Deferred tax assets TOTAL NON-CURRENT ASSETS CURRENT ASSETS Inventories Receivables, deposits and prepayments Amounts due from related parties Loans due from a subsidiary Derivative financial instruments Tax recoverable Deposits, cash and bank balances TOTAL CURRENT ASSETS TOTAL ASSETS 18,451 17339 25,119 26,738 24 3 2,390 10 21 26 16 2,056 30 5 18 222 22 1 27 582 560 10 15 20 2.986 237 2.666 19,805 21,437 25,356 26.758 Less than RM1 million. maxis OVERVIEW OUR STRATEGY AND VALUE CREATION OUR PERFORMANCE Statements of Financial Position As at 31 December 2019 Group 2019 2018 RM million RM'million Company 2019 2018 RM'million RM million Note 28 127 4.323 116 4.020 29 18 25 26 25 5 201 30 22 1,053 3 126 199 1 LESS CURRENT LIABILITIES Provisions for liabilities and charges Payables and accruals Amount due to a subsidiary Amounts due to fellow subsidiaries Amounts due to related parties Borrowings Derivative financial instruments Taxation TOTAL CURRENT LIABILITIES NET CURRENT (LIABILITIES) / ASSETS NON-CURRENT LIABILITIES Provisions for liabilities and charges Payables and accruals Borrowings Derivative financial instruments Deferred tax liabilities TOTAL NON-CURRENT LIABILITIES NET ASSETS 5,657 2 4,541 (1875) (2.671) 235 19 312 168 28 29 30 22 23 311 278 7,894 6 7,439 221 8,710 7,070 196 8,115 7149 25,354 26,757 31 EQUITY Share capital Reserves TOTAL EQUITY 32 2.532 4.538 7,070 2.509 4,640 7149 2,532 22,822 25,354 2.509 24.248 26.757 Less than RM1 million SUSTAINABILITY AT MAXIS EMBEDDING TRUST FINANCIAL STATEMENTS OTHER INFORMATION integrated Annual Report 2019 Statements of Changes in Equity For the Financial Year Ended 31 December 2019 - Attributable to equity holders of the Company Issued and fully paid Ordinary shares Reserve arising from Merger reverse Other Number of Share relief acquisition reserves Retained Total capital (Note 32(a)) (Note 32(b)) (Note 32ich earnings equity million RM"million RM million RM million RM million RM million RM'million shares Group Note 7,817 2,509 22,729 (22,729) 119 4,521 7,149 37 (42) 4.479 7,817 2,509 22,729 (22.729) 119 (42) 7,107 1,519 1,519 At 31 December 2018, as previously reported Opening balance adjustments from adoption of MFRS 16 Restated at 1 January 2019 Profit for the financial year Other comprehensive expense for the financial year Total comprehensive (expense income for the financial year Dividends provided for or paid ESOS and LTIP Total transactions with owners, recognised directly in equity At 31 December 2019 (10) (10) (10) 14 1,519 (1,564) 37 1,509 (1,564) 18 3210 3 23 (42) 3 23 (42) 67 (1,527) 4,471 (1.546) 7,070 7,820 2,532 22,729 (22,729) maxis OVERVIEW OUR STRATEGY AND VALUE CREATION OUR PERFORMANCE Statements of Changes in Equity For the Financial Year Ended 31 December 2019 Attributable to equity holders of the Company Issued and fully paid ordinary shares Reserve arising from Merger reverse Other Number of Share relief acquisition reserves Retained Total shares capital (Note 32(a) (Note 32(b) (Note 32(C) earnings equity million RM'million RM'million RM'million RM'million RM'million RM million 2.8 2.469 22.729 (22,729) 151 4.298 6,918 1,780 1.780 Note 10 ( Group As at 1 January 2018 Profit for the financial year Other comprehensive expense for the financial year Total comprehensive expensey income for the financial year Dividends provided for or paid ESOS and LTIP Incentive arrangement Total transactions with owners. recognised directly in equity At 31 December 2018 (0 1780 1.779 14 (1.563) 6 3210) 40 126) (5) (1,563) 20 (5) 3210 6 40 (31) (1557) 4,521 (1.548) 7349 7817 2.509 22.729 (22.729) 119