Answered step by step
Verified Expert Solution
Question
1 Approved Answer
Assignment: It is easier to make an interpretation of data if it is charted or graphed. In this assignment, you will be asked to make
Assignment:
It is easier to make an interpretation of data if it is charted or graphed. In this assignment, you will be asked to make interpretations on key parts of a chart within a business context.
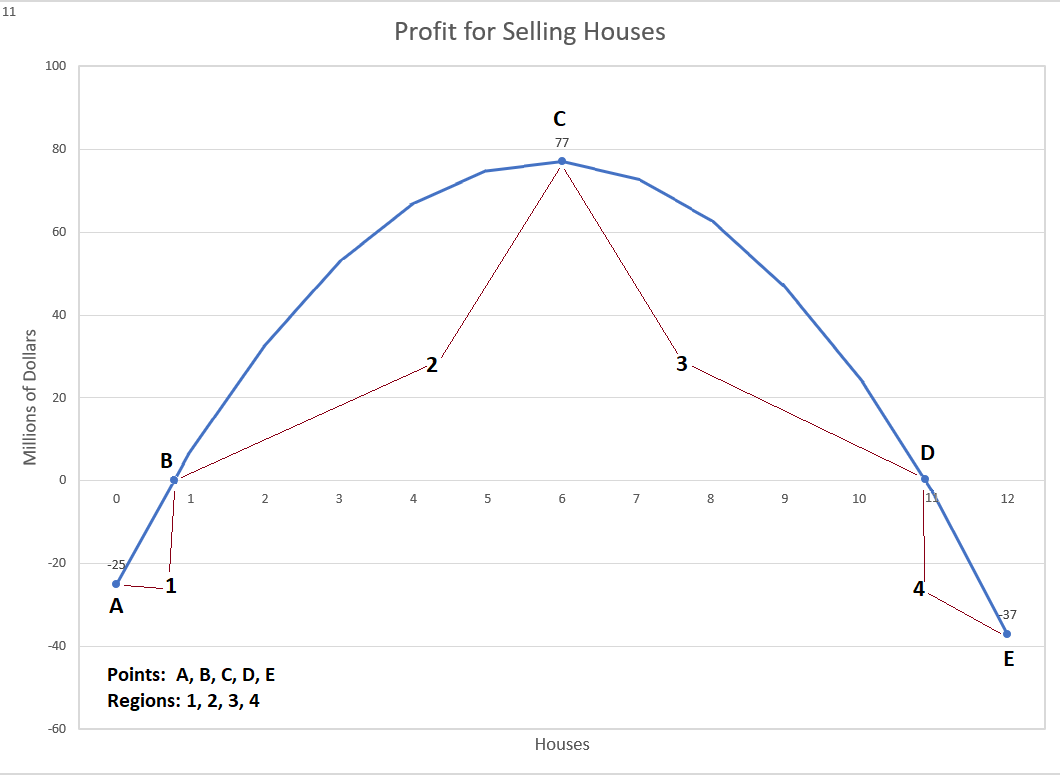
Suppose you given the following chart that shows the profit in millions of dollars for selling homes.

Notice that area of interest on the charts as indicated by points (A, B, C, D, and E) and regions (1, 2, 3, and 4). Many things can be said about the points and regions.
- Based on what you have covered on business functions and functions in general, what can be said about each of the 5 points A-E? Your answer should be in a business context.
- In addition, what can be said about each of the 4 regions 1-4 in a business context? Your background in accounting and the research you do will help you. You will also work as a team to support each other and complete the answers based on the teams background and research.
Step by Step Solution
There are 3 Steps involved in it
Step: 1

Get Instant Access to Expert-Tailored Solutions
See step-by-step solutions with expert insights and AI powered tools for academic success
Step: 2

Step: 3

Ace Your Homework with AI
Get the answers you need in no time with our AI-driven, step-by-step assistance
Get Started


