Answered step by step
Verified Expert Solution
Question
1 Approved Answer
Assignment Question #3: a) Calculate the proportion of debt versus equity financing for each of the comparison firms, and based on the calculations, determine what
Assignment Question #3: a) Calculate the proportion of debt versus equity financing for each of the comparison firms, and based on the calculations, determine what WACC Langtry Falls should use. Explain why. b) Consider what questions Langtry should make when considering their expansion plan.
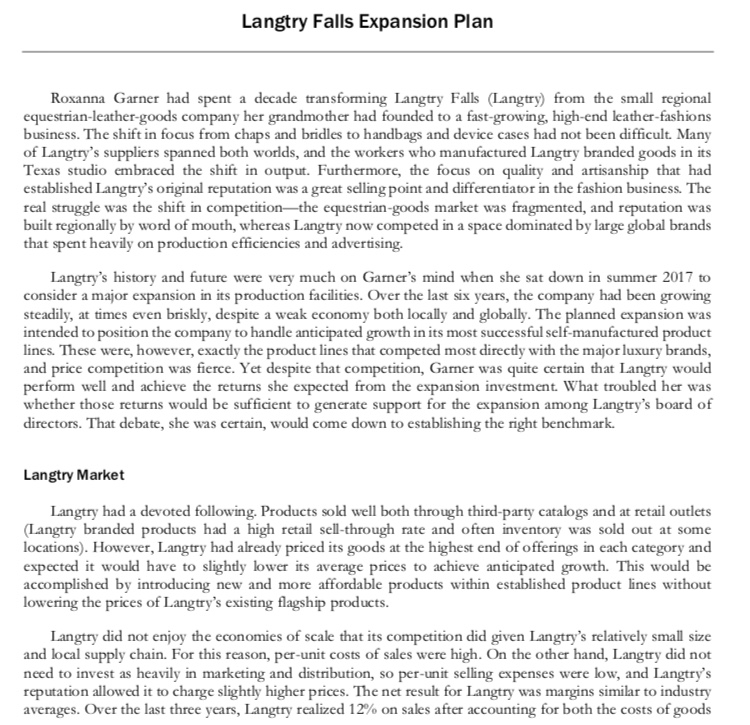
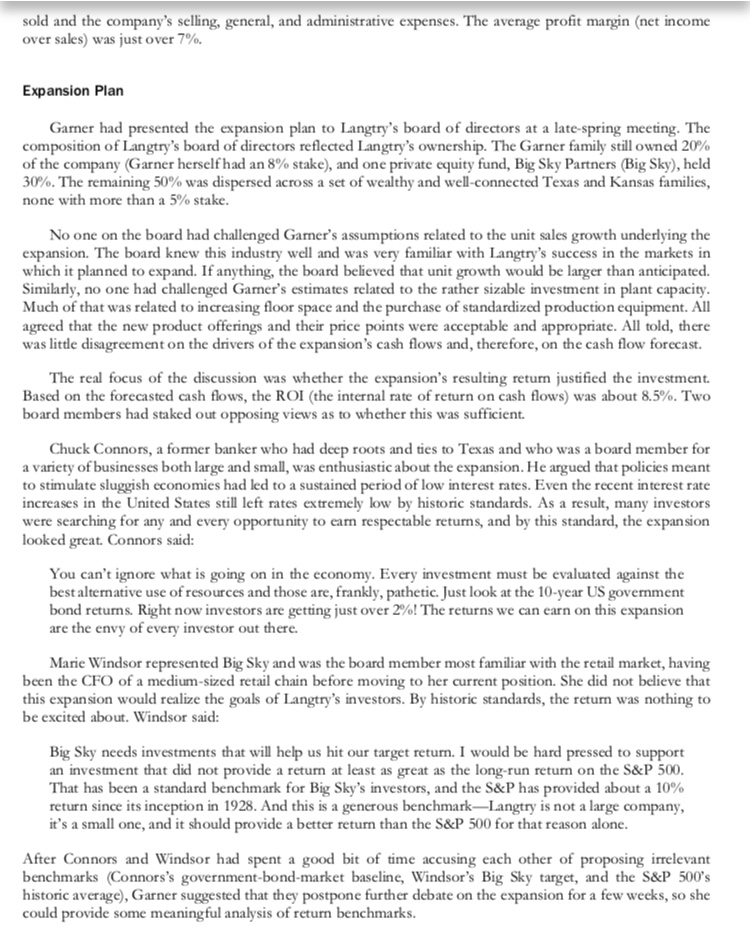
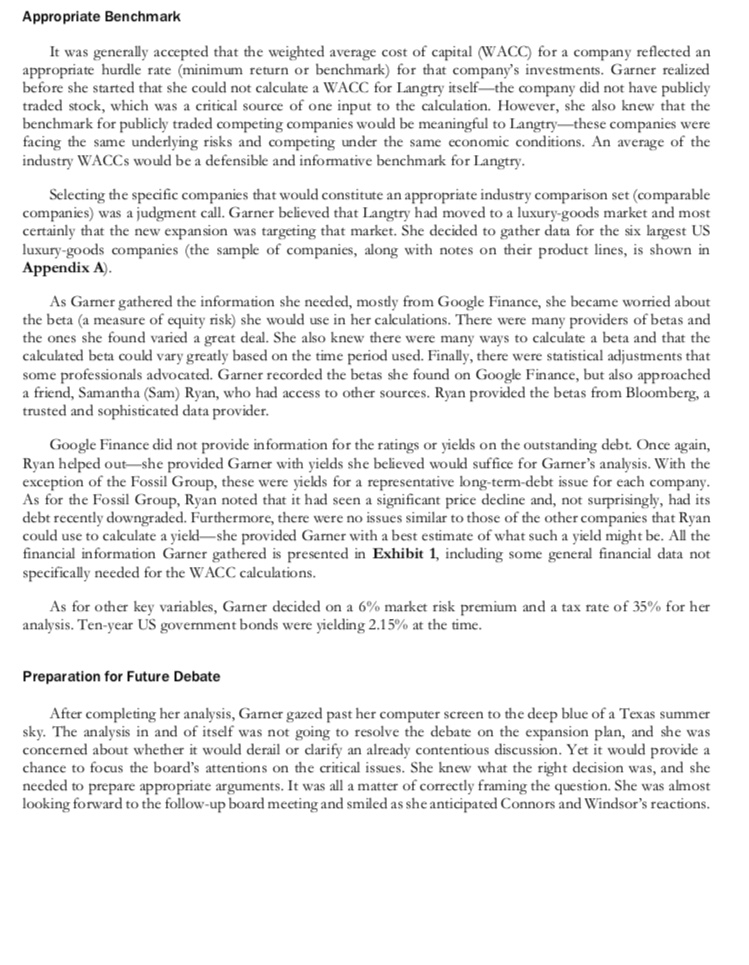
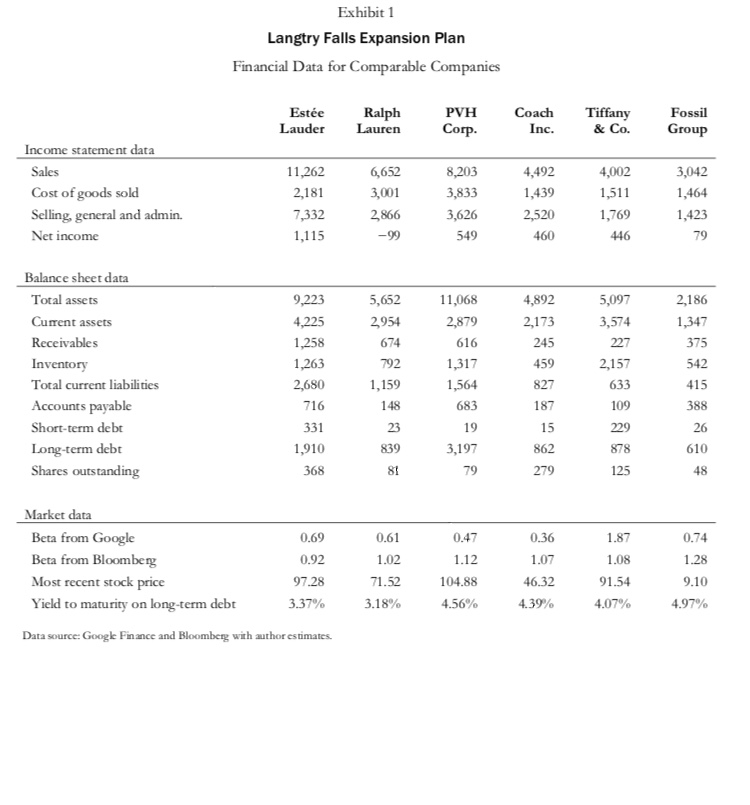
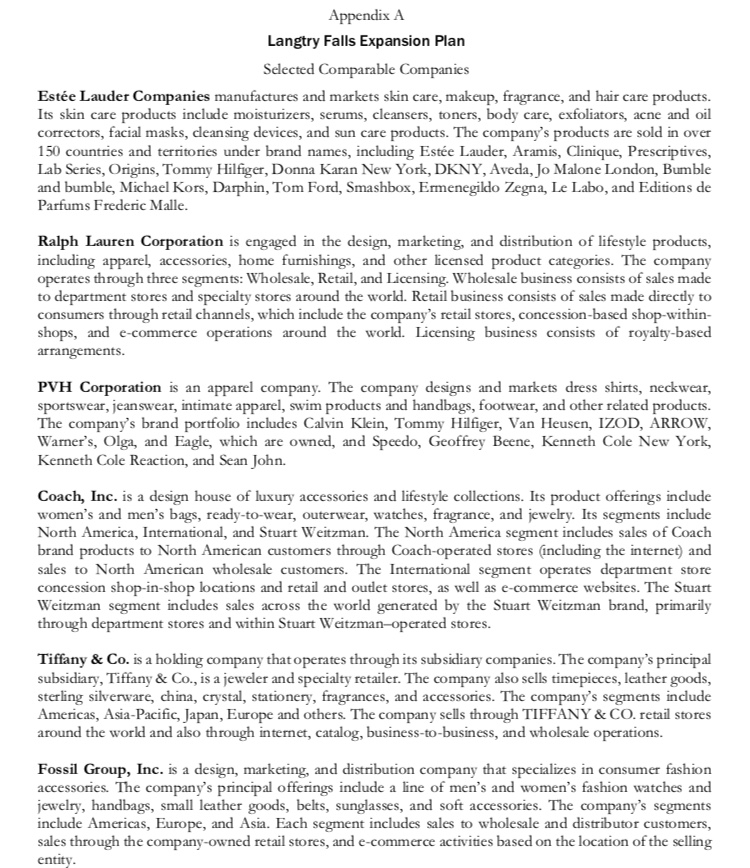
Langtry Falls Expansion Plan Roxanna Garner had spent a decade transforming Langtry Falls (Langtry) from the small regional equestrian-leather-goods company her grandmother had founded to a fast-growing, high-end leather-fashions business. The shift in focus from chaps and bridles to handbags and device cases had not been difficult. Many of Langtry's suppliers spanned both worlds, and the workers who manufactured Langtry branded goods in its Texas studio embraced the shift in output. Furthermore, the focus on quality and artisanship that had established Langtry's original reputation was a great selling point and differentiator in the fashion business. The real struggle was the shift in competitionthe equestrian-goods market was fragmented, and reputation was built regionally by word of mouth, whereas Langtry now competed in a space dominated by large global brands that spent heavily on production efficiencies and advertising, Langtry's history and future were very much on Gamer's mind when she sat down in summer 2017 to consider a major expansion in its production facilities. Over the last six years, the company had been growing steadily, at times even briskly, despite a weak economy both locally and globally. The planned expansion was intended to position the company to handle anticipated growth in its most successful self-manufactured product lines. These were, however, exactly the product lines that competed most directly with the major luxury brands, and price competition was fierce. Yet despite that competition, Garner was quite certain that Langtry would perform well and achieve the returns she expected from the expansion investment. What troubled her was whether those returns would be sufficient to generate support for the expansion among Langtry's board of directors. That debate, she was certain, would come down to establishing the right benchmark. Langtry Market Langtry had a devoted following. Products sold well both through third-party catalogs and at retail outlets (Langtry branded products had a high retail sell-through rate and often inventory was sold out at some locations). However, Langtry had already priced its goods at the highest end of offerings in each category and expected it would have to slightly lower its average prices to achieve anticipated growth. This would be accomplished by introducing new and more affordable products within established product lines without lowering the prices of Langtry's existing flagship products. Langtry did not enjoy the economies of scale that its competition did given Langtry's relatively small size and local supply chain. For this reason, per-unit costs of sales were high. On the other hand, Langtry did not need to invest as heavily in marketing and distribution, so per-unit selling expenses were low, and Langtry's reputation allowed it to charge slightly higher prices. The net result for Langtry was margins similar to industry averages. Over the last three years, Langtry realized 12% on sales after accounting for both the costs of goods sold and the company's selling, general, and administrative expenses. The average profit margin (net income over sales) was just over 7%. Expansion Plan Garner had presented the expansion plan to Langtry's board of directors at a late-spring meeting. The composition of Langtry's board of directors reflected Langtry's ownership. The Garner family still owned 20% of the company Garner herself had an 8% stake), and one private equity fund, Big Sky Partners (Big Sky), held 30%. The remaining 50% was dispersed across a set of wealthy and well-connected Texas and Kansas families, none with more than a 5% stake. No one on the board had challenged Gamer's assumptions related to the unit sales growth underlying the expansion. The board knew this industry well and was very familiar with Langtry's success in the markets in which it planned to expand. If anything, the board believed that unit growth would be larger than anticipated. Similarly, no one had challenged Garner's estimates related to the rather sizable investment in plant capacity. Much of that was related to increasing floor space and the purchase of standardized production equipment. All agreed that the new product offerings and their price points were acceptable and appropriate. All told, there was little disagreement on the drivers of the expansion's cash flows and therefore, on the cash flow forecast. The real focus of the discussion was whether the expansion's resulting return justified the investment. Based on the forecasted cash flows, the ROI (the internal rate of return on cash flows) was about 8.5%. Two board members had staked out opposing views as to whether this was sufficient. Chuck Connors, a former banker who had deep roots and ties to Texas and who was a board member for a variety of businesses both large and small, was enthusiastic about the expansion. He argued that policies meant to stimulate sluggish economies had led to a sustained period of low interest rates. Even the recent interest rate increases in the United States still left rates extremely low by historic standards. As a result, many investors were searching for any and every opportunity to earn respectable returns, and by this standard, the expansion looked great. Connors said: You can't ignore what is going on in the economy. Every investment must be evaluated against the best alternative use of resources and those are, frankly, pathetic. Just look at the 10-year US government bond returns. Right now investors are getting just over 2%! The returns we can earn on this expansion are the envy of every investor out there. Marie Windsor represented Big Sky and was the board member most familiar with the retail market, having been the CFO of a medium-sized retail chain before moving to her current position. She did not believe that this expansion would realize the goals of Langtry's investors. By historic standards, the return was nothing to be excited about. Windsor said: Big Sky needs investments that will help us hit our target return. I would be hard pressed to support an investment that did not provide a return at least as great as the long-run return on the S&P 500. That has been a standard benchmark for Big Sky's investors, and the S&P has provided about a 10% return since its inception in 1928. And this is a generous benchmark-Langtry is not a large company, it's a small one, and it should provide a better return than the S&P 500 for that reason alone. After Connors and Windsor had spent a good bit of time accusing each other of proposing irrelevant benchmarks (Connors's government-bond-market baseline, Windsor's Big Sky target, and the S&P 500's historic average), Garner suggested that they postpone further debate on the expansion for a few weeks, so she could provide some meaningful analysis of return benchmarks. Appropriate Benchmark It was generally accepted that the weighted average cost of capital (WACC) for a company reflected an appropriate hurdle rate (minimum return or benchmark) for that company's investments. Garner realized before she started that she could not calculate a WACC for Langtry itself-the company did not have publicly traded stock, which was a critical source of one input to the calculation. However, she also knew that the benchmark for publicly traded competing companies would be meaningful to Langtrythese companies were facing the same underlying risks and competing under the same economic conditions. An average of the industry WACCs would be a defensible and informative benchmark for Langtry. Selecting the specific companies that would constitute an appropriate industry comparison set (comparable companies) was a judgment call. Garner believed that Langtry had moved to a luxury-goods market and most certainly that the new expansion was targeting that market. She decided to gather data for the six largest US luxury-goods companies (the sample of companies, along with notes on their product lines, is shown in Appendix A. As Gamer gathered the information she needed, mostly from Google Finance, she became worried about the beta (a measure of equity risk) she would use in her calculations. There were many providers of betas and the ones she found varied a great deal. She also knew there were many ways to calculate a beta and that the calculated beta could vary greatly based on the time period used. Finally, there were statistical adjustments that some professionals advocated. Garner recorded the betas she found on Google Finance, but also approached a friend, Samantha (Sam) Ryan, who had access to other sources. Ryan provided the betas from Bloomberg, a trusted and sophisticated data provider. Google Finance did not provide information for the ratings or yields on the outstanding debt. Once again, Ryan helped out-she provided Garner with yields she believed would suffice for Gamer's analysis. With the exception of the Fossil Group, these were yields for a representative long-term-debt issue for each company. As for the Fossil Group, Ryan noted that it had seen a significant price decline and, not surprisingly, had its debt recently downgraded. Furthermore, there were no issues similar to those of the other companies that Ryan could use to calculate a yield-she provided Garner with a best estimate of what such a yield might be. All the financial information Garner gathered is presented in Exhibit 1, including some general financial data not specifically needed for the WACC calculations. As for other key variables, Gamer decided on a 6% market risk premium and a tax rate of 35% for her analysis. Ten-year US government bonds were yielding 2.15% at the time. Preparation for Future Debate After completing her analysis, Garner gazed past her computer screen to the deep blue of a Texas summer sky. The analysis in and of itself was not going to resolve the debate on the expansion plan, and she was concerned about whether it would derail or clarify an already contentious discussion. Yet it would provide a chance to focus the board's attentions on the critical issues. She knew what the right decision was, and she needed to prepare appropriate arguments. It was all a matter of correctly framing the question. She was almost looking forward to the follow-up board meeting and smiled as she anticipated Connors and Windsor's reactions. Exhibit 1 Langtry Falls Expansion Plan Financial Data for Comparable Companies Este Lauder Ralph Lauren PVH Corp. Coach Inc. Tiffany & Co. Fossil Group Income statement data Sales Cost of goods sold Selling, general and admin. Net income 11,262 2,181 7,332 1,115 6,652 3,001 2,866 8,203 3,833 3,626 549 4,492 1,439 2,520 460 4,002 1,511 1,769 446 3,042 1,464 1,423 79 -99 5,652 4,892 2,173 2,186 1,347 2,954 674 245 375 Balance sheet data Total assets Current assets Receivables Inventory Total current liabilities Accounts payable Short-term debt Long-term debt Shares outstanding 9,223 4,225 1,258 1,263 2,680 716 331 1,910 368 11,068 2,879 616 1,317 1,564 683 19 5,097 3,574 227 2,157 633 109 1,159 15 3,197 862 279 79 0.74 Market data Beta from Google Beta from Bloomberg Most recent stock price Yield to maturity on long-term debt 0.69 0.92 97.28 3.37% 0.61 1.02 71.52 3.18% 0.47 1.12 104.88 4.56% 0.36 1.07 46.32 4.39% 1.87 1.08 91.54 4.07% 1.28 9.10 4.97% Data source: Google Finance and Bloomberg with author estimates. Appendix A Langtry Falls Expansion Plan Selected Comparable Companies Este Lauder Companies manufactures and markets skin care, makeup, fragrance, and hair care products. Its skin care products include moisturizers, serums, cleansers, toners, body care, exfoliators, acne and oil correctors, facial masks, cleansing devices, and sun care products. The company's products are sold in over 150 countries and territories under brand names, including Este Lauder, Aramis, Clinique, Prescriptives, Lab Series, Origins, Tommy Hilfiger, Donna Karan New York, DKNY, Aveda, Jo Malone London, Bumble and bumble, Michael Kors, Darphin, Tom Ford, Smashbox, Ermenegildo Zegna, Le Labo, and Editions de Parfums Frederic Malle. Ralph Lauren Corporation is engaged in the design, marketing, and distribution of lifestyle products, including apparel, accessories, home furnishings, and other licensed product categories. The company operates through three segments: Wholesale, Retail, and Licensing. Wholesale business consists of sales made to department stores and specialty stores around the world. Retail business consists of sales made directly to consumers through retail channels, which include the company's retail stores, concession-based shop-within- shops, and e-commerce operations around the world. Licensing business consists of royalty-based arrangements. PVH Corporation is an apparel company. The company designs and markets dress shirts, neckwear, sportswear, jeanswear, intimate apparel, swim products and handbags, footwear, and other related products. The company's brand portfolio includes Calvin Klein, Tommy Hilfiger, Van Heusen, IZOD, ARROW, Wamer's, Olga, and Eagle, which are owned, and Speedo, Geoffrey Beene, Kenneth Cole New York, Kenneth Cole Reaction, and Sean John. Coach, Inc. is a design house of luxury accessories and lifestyle collections. Its product offerings include women's and men's bags, ready-to-wear, outerwear, watches, fragrance, and jewelry. Its segments include North America, International, and Stuart Weitzman. The North America segment includes sales of Coach brand products to North American customers through Coach-operated stores including the internet) and sales to North American wholesale customers. The International segment operates department store concession shop-in-shop locations and retail and outlet stores, as well as e-commerce websites. The Stuart Weitzman segment indudes sales across the world generated by the Stuart Weitzman brand, primarily through department stores and within Stuart Weitzman-operated stores. Tiffany & Co. is a holding company that operates through its subsidiary companies. The company's principal subsidiary, Tiffany & Co., is a jeweler and specialty retailer. The company also sells timepieces, leather goods, sterling silverware, china, crystal, stationery, fragrances, and accessories. The company's segments include Americas, Asia-Pacific, Japan, Europe and others. The company sells through TIFFANY & CO. retail stores around the world and also through internet, catalog, business-to-business, and wholesale operations. Fossil Group, Inc. is a design, marketing, and distribution company that specializes in consumer fashion accessories. The company's principal offerings include a line of men's and women's fashion watches and jewelry, handbags, small leather goods, belts, sunglasses, and soft accessories. The company's segments include Americas, Europe, and Asia. Each segment includes sales to wholesale and distributor customers, sales through the company-owned retail stores, and e-commerce activities based on the location of the selling entity. Langtry Falls Expansion Plan Roxanna Garner had spent a decade transforming Langtry Falls (Langtry) from the small regional equestrian-leather-goods company her grandmother had founded to a fast-growing, high-end leather-fashions business. The shift in focus from chaps and bridles to handbags and device cases had not been difficult. Many of Langtry's suppliers spanned both worlds, and the workers who manufactured Langtry branded goods in its Texas studio embraced the shift in output. Furthermore, the focus on quality and artisanship that had established Langtry's original reputation was a great selling point and differentiator in the fashion business. The real struggle was the shift in competitionthe equestrian-goods market was fragmented, and reputation was built regionally by word of mouth, whereas Langtry now competed in a space dominated by large global brands that spent heavily on production efficiencies and advertising, Langtry's history and future were very much on Gamer's mind when she sat down in summer 2017 to consider a major expansion in its production facilities. Over the last six years, the company had been growing steadily, at times even briskly, despite a weak economy both locally and globally. The planned expansion was intended to position the company to handle anticipated growth in its most successful self-manufactured product lines. These were, however, exactly the product lines that competed most directly with the major luxury brands, and price competition was fierce. Yet despite that competition, Garner was quite certain that Langtry would perform well and achieve the returns she expected from the expansion investment. What troubled her was whether those returns would be sufficient to generate support for the expansion among Langtry's board of directors. That debate, she was certain, would come down to establishing the right benchmark. Langtry Market Langtry had a devoted following. Products sold well both through third-party catalogs and at retail outlets (Langtry branded products had a high retail sell-through rate and often inventory was sold out at some locations). However, Langtry had already priced its goods at the highest end of offerings in each category and expected it would have to slightly lower its average prices to achieve anticipated growth. This would be accomplished by introducing new and more affordable products within established product lines without lowering the prices of Langtry's existing flagship products. Langtry did not enjoy the economies of scale that its competition did given Langtry's relatively small size and local supply chain. For this reason, per-unit costs of sales were high. On the other hand, Langtry did not need to invest as heavily in marketing and distribution, so per-unit selling expenses were low, and Langtry's reputation allowed it to charge slightly higher prices. The net result for Langtry was margins similar to industry averages. Over the last three years, Langtry realized 12% on sales after accounting for both the costs of goods sold and the company's selling, general, and administrative expenses. The average profit margin (net income over sales) was just over 7%. Expansion Plan Garner had presented the expansion plan to Langtry's board of directors at a late-spring meeting. The composition of Langtry's board of directors reflected Langtry's ownership. The Garner family still owned 20% of the company Garner herself had an 8% stake), and one private equity fund, Big Sky Partners (Big Sky), held 30%. The remaining 50% was dispersed across a set of wealthy and well-connected Texas and Kansas families, none with more than a 5% stake. No one on the board had challenged Gamer's assumptions related to the unit sales growth underlying the expansion. The board knew this industry well and was very familiar with Langtry's success in the markets in which it planned to expand. If anything, the board believed that unit growth would be larger than anticipated. Similarly, no one had challenged Garner's estimates related to the rather sizable investment in plant capacity. Much of that was related to increasing floor space and the purchase of standardized production equipment. All agreed that the new product offerings and their price points were acceptable and appropriate. All told, there was little disagreement on the drivers of the expansion's cash flows and therefore, on the cash flow forecast. The real focus of the discussion was whether the expansion's resulting return justified the investment. Based on the forecasted cash flows, the ROI (the internal rate of return on cash flows) was about 8.5%. Two board members had staked out opposing views as to whether this was sufficient. Chuck Connors, a former banker who had deep roots and ties to Texas and who was a board member for a variety of businesses both large and small, was enthusiastic about the expansion. He argued that policies meant to stimulate sluggish economies had led to a sustained period of low interest rates. Even the recent interest rate increases in the United States still left rates extremely low by historic standards. As a result, many investors were searching for any and every opportunity to earn respectable returns, and by this standard, the expansion looked great. Connors said: You can't ignore what is going on in the economy. Every investment must be evaluated against the best alternative use of resources and those are, frankly, pathetic. Just look at the 10-year US government bond returns. Right now investors are getting just over 2%! The returns we can earn on this expansion are the envy of every investor out there. Marie Windsor represented Big Sky and was the board member most familiar with the retail market, having been the CFO of a medium-sized retail chain before moving to her current position. She did not believe that this expansion would realize the goals of Langtry's investors. By historic standards, the return was nothing to be excited about. Windsor said: Big Sky needs investments that will help us hit our target return. I would be hard pressed to support an investment that did not provide a return at least as great as the long-run return on the S&P 500. That has been a standard benchmark for Big Sky's investors, and the S&P has provided about a 10% return since its inception in 1928. And this is a generous benchmark-Langtry is not a large company, it's a small one, and it should provide a better return than the S&P 500 for that reason alone. After Connors and Windsor had spent a good bit of time accusing each other of proposing irrelevant benchmarks (Connors's government-bond-market baseline, Windsor's Big Sky target, and the S&P 500's historic average), Garner suggested that they postpone further debate on the expansion for a few weeks, so she could provide some meaningful analysis of return benchmarks. Appropriate Benchmark It was generally accepted that the weighted average cost of capital (WACC) for a company reflected an appropriate hurdle rate (minimum return or benchmark) for that company's investments. Garner realized before she started that she could not calculate a WACC for Langtry itself-the company did not have publicly traded stock, which was a critical source of one input to the calculation. However, she also knew that the benchmark for publicly traded competing companies would be meaningful to Langtrythese companies were facing the same underlying risks and competing under the same economic conditions. An average of the industry WACCs would be a defensible and informative benchmark for Langtry. Selecting the specific companies that would constitute an appropriate industry comparison set (comparable companies) was a judgment call. Garner believed that Langtry had moved to a luxury-goods market and most certainly that the new expansion was targeting that market. She decided to gather data for the six largest US luxury-goods companies (the sample of companies, along with notes on their product lines, is shown in Appendix A. As Gamer gathered the information she needed, mostly from Google Finance, she became worried about the beta (a measure of equity risk) she would use in her calculations. There were many providers of betas and the ones she found varied a great deal. She also knew there were many ways to calculate a beta and that the calculated beta could vary greatly based on the time period used. Finally, there were statistical adjustments that some professionals advocated. Garner recorded the betas she found on Google Finance, but also approached a friend, Samantha (Sam) Ryan, who had access to other sources. Ryan provided the betas from Bloomberg, a trusted and sophisticated data provider. Google Finance did not provide information for the ratings or yields on the outstanding debt. Once again, Ryan helped out-she provided Garner with yields she believed would suffice for Gamer's analysis. With the exception of the Fossil Group, these were yields for a representative long-term-debt issue for each company. As for the Fossil Group, Ryan noted that it had seen a significant price decline and, not surprisingly, had its debt recently downgraded. Furthermore, there were no issues similar to those of the other companies that Ryan could use to calculate a yield-she provided Garner with a best estimate of what such a yield might be. All the financial information Garner gathered is presented in Exhibit 1, including some general financial data not specifically needed for the WACC calculations. As for other key variables, Gamer decided on a 6% market risk premium and a tax rate of 35% for her analysis. Ten-year US government bonds were yielding 2.15% at the time. Preparation for Future Debate After completing her analysis, Garner gazed past her computer screen to the deep blue of a Texas summer sky. The analysis in and of itself was not going to resolve the debate on the expansion plan, and she was concerned about whether it would derail or clarify an already contentious discussion. Yet it would provide a chance to focus the board's attentions on the critical issues. She knew what the right decision was, and she needed to prepare appropriate arguments. It was all a matter of correctly framing the question. She was almost looking forward to the follow-up board meeting and smiled as she anticipated Connors and Windsor's reactions. Exhibit 1 Langtry Falls Expansion Plan Financial Data for Comparable Companies Este Lauder Ralph Lauren PVH Corp. Coach Inc. Tiffany & Co. Fossil Group Income statement data Sales Cost of goods sold Selling, general and admin. Net income 11,262 2,181 7,332 1,115 6,652 3,001 2,866 8,203 3,833 3,626 549 4,492 1,439 2,520 460 4,002 1,511 1,769 446 3,042 1,464 1,423 79 -99 5,652 4,892 2,173 2,186 1,347 2,954 674 245 375 Balance sheet data Total assets Current assets Receivables Inventory Total current liabilities Accounts payable Short-term debt Long-term debt Shares outstanding 9,223 4,225 1,258 1,263 2,680 716 331 1,910 368 11,068 2,879 616 1,317 1,564 683 19 5,097 3,574 227 2,157 633 109 1,159 15 3,197 862 279 79 0.74 Market data Beta from Google Beta from Bloomberg Most recent stock price Yield to maturity on long-term debt 0.69 0.92 97.28 3.37% 0.61 1.02 71.52 3.18% 0.47 1.12 104.88 4.56% 0.36 1.07 46.32 4.39% 1.87 1.08 91.54 4.07% 1.28 9.10 4.97% Data source: Google Finance and Bloomberg with author estimates. Appendix A Langtry Falls Expansion Plan Selected Comparable Companies Este Lauder Companies manufactures and markets skin care, makeup, fragrance, and hair care products. Its skin care products include moisturizers, serums, cleansers, toners, body care, exfoliators, acne and oil correctors, facial masks, cleansing devices, and sun care products. The company's products are sold in over 150 countries and territories under brand names, including Este Lauder, Aramis, Clinique, Prescriptives, Lab Series, Origins, Tommy Hilfiger, Donna Karan New York, DKNY, Aveda, Jo Malone London, Bumble and bumble, Michael Kors, Darphin, Tom Ford, Smashbox, Ermenegildo Zegna, Le Labo, and Editions de Parfums Frederic Malle. Ralph Lauren Corporation is engaged in the design, marketing, and distribution of lifestyle products, including apparel, accessories, home furnishings, and other licensed product categories. The company operates through three segments: Wholesale, Retail, and Licensing. Wholesale business consists of sales made to department stores and specialty stores around the world. Retail business consists of sales made directly to consumers through retail channels, which include the company's retail stores, concession-based shop-within- shops, and e-commerce operations around the world. Licensing business consists of royalty-based arrangements. PVH Corporation is an apparel company. The company designs and markets dress shirts, neckwear, sportswear, jeanswear, intimate apparel, swim products and handbags, footwear, and other related products. The company's brand portfolio includes Calvin Klein, Tommy Hilfiger, Van Heusen, IZOD, ARROW, Wamer's, Olga, and Eagle, which are owned, and Speedo, Geoffrey Beene, Kenneth Cole New York, Kenneth Cole Reaction, and Sean John. Coach, Inc. is a design house of luxury accessories and lifestyle collections. Its product offerings include women's and men's bags, ready-to-wear, outerwear, watches, fragrance, and jewelry. Its segments include North America, International, and Stuart Weitzman. The North America segment includes sales of Coach brand products to North American customers through Coach-operated stores including the internet) and sales to North American wholesale customers. The International segment operates department store concession shop-in-shop locations and retail and outlet stores, as well as e-commerce websites. The Stuart Weitzman segment indudes sales across the world generated by the Stuart Weitzman brand, primarily through department stores and within Stuart Weitzman-operated stores. Tiffany & Co. is a holding company that operates through its subsidiary companies. The company's principal subsidiary, Tiffany & Co., is a jeweler and specialty retailer. The company also sells timepieces, leather goods, sterling silverware, china, crystal, stationery, fragrances, and accessories. The company's segments include Americas, Asia-Pacific, Japan, Europe and others. The company sells through TIFFANY & CO. retail stores around the world and also through internet, catalog, business-to-business, and wholesale operations. Fossil Group, Inc. is a design, marketing, and distribution company that specializes in consumer fashion accessories. The company's principal offerings include a line of men's and women's fashion watches and jewelry, handbags, small leather goods, belts, sunglasses, and soft accessories. The company's segments include Americas, Europe, and Asia. Each segment includes sales to wholesale and distributor customers, sales through the company-owned retail stores, and e-commerce activities based on the location of the selling entityStep by Step Solution
There are 3 Steps involved in it
Step: 1

Get Instant Access to Expert-Tailored Solutions
See step-by-step solutions with expert insights and AI powered tools for academic success
Step: 2

Step: 3

Ace Your Homework with AI
Get the answers you need in no time with our AI-driven, step-by-step assistance
Get Started


