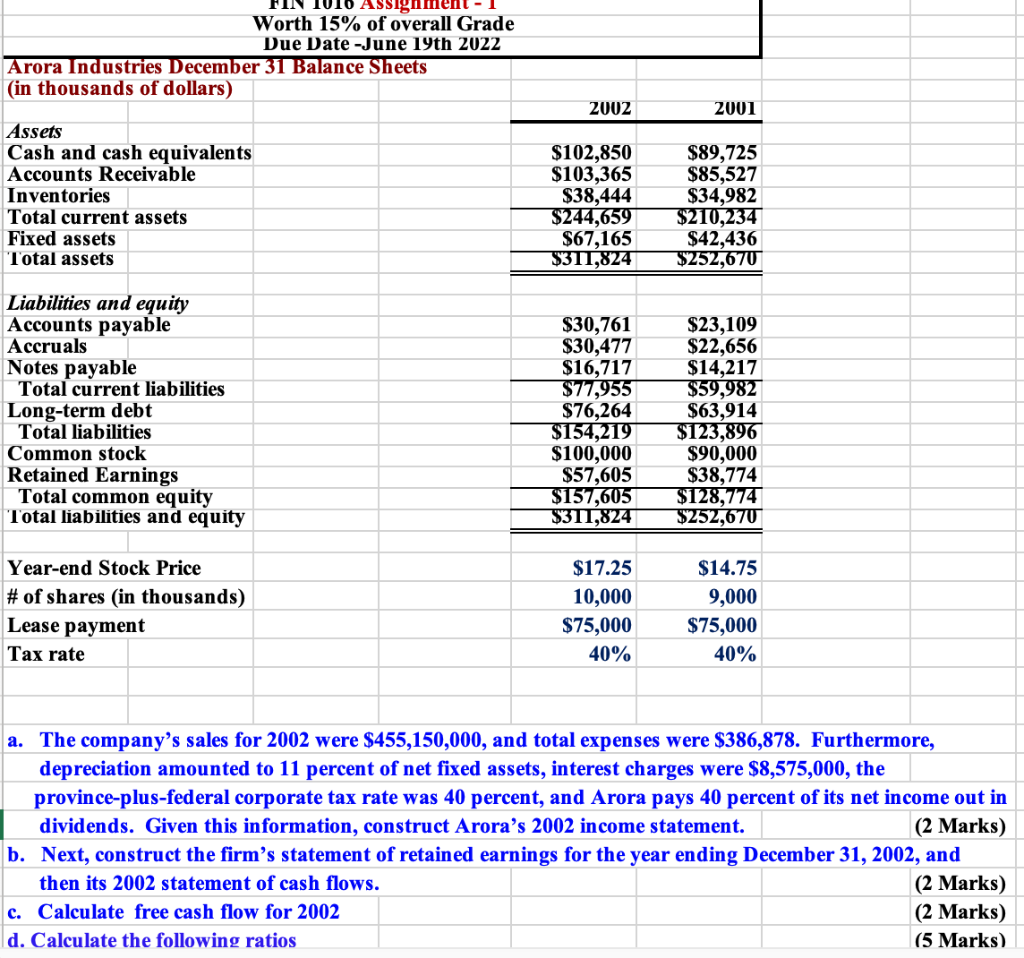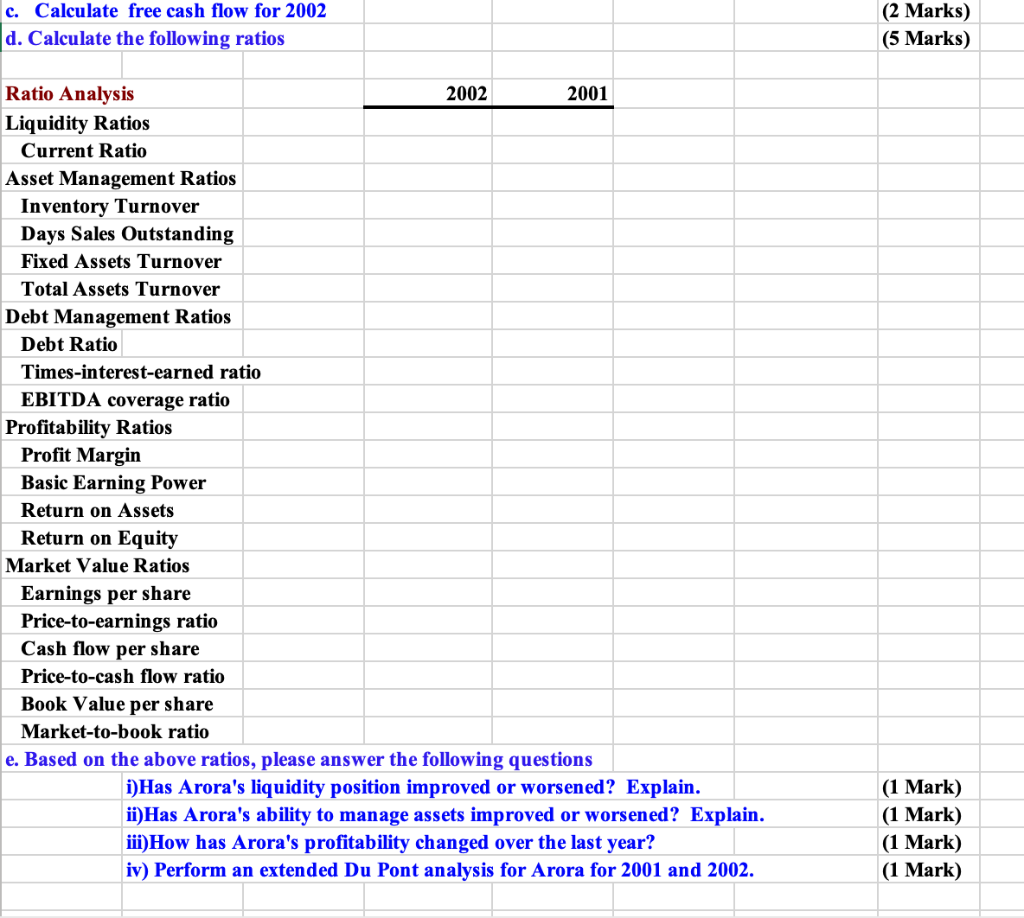

Assignment Worth 15% of overall Grade Due Date -June 19th 2022 31 Balance Sheets Arora Industries December (in thousands of dollars) 2002 2001 Assets $102,850 $89,725 Cash and cash equivalents Accounts Receivable Inventories $103,365 $85,527 $38,444 $34,982 Total current assets $244,659 $210,234 Fixed assets $67,165 $42,436 Total assets $311,824 $252,670 Liabilities and equity Accounts payable Accruals $30,761 $23,109 $30,477 $22,656 Notes payable $16,717 $14,217 Total current liabilities $77.955 $59,982 Long-term debt $76,264 $63,914 $154,219 $123,896 Total liabilities Common stock Retained Earnings $100,000 $90,000 $57,605 $38,774 $157,605 $128,774 Total common equity Total liabilities and equity $311,824 $252,670 Year-end Stock Price $17.25 $14.75 # of shares (in thousands) 10,000 9,000 Lease payment $75,000 $75,000 Tax rate 40% 40% a. The company's sales for 2002 were $455,150,000, and total expenses were $386,878. Furthermore, depreciation amounted to 11 percent of net fixed assets, interest charges were $8,575,000, the province-plus-federal corporate tax rate was 40 percent, and Arora pays 40 percent of its net income out in dividends. Given this information, construct Arora's 2002 income statement. (2 Marks) b. Next, construct the firm's statement of retained earnings for the year ending December 31, 2002, and then its 2002 statement of cash flows. (2 Marks) (2 Marks) c. Calculate free cash flow for 2002 d. Calculate the following ratios (5 Marks) c. Calculate free cash flow for 2002 d. Calculate the following ratios Ratio Analysis 2001 Liquidity Ratios Current Ratio Asset Management Ratios Inventory Turnover Days Sales Outstanding Fixed Assets Turnover Total Assets Turnover Debt Management Ratios Debt Ratio Times-interest-earned ratio EBITDA coverage ratio Profitability Ratios Profit Margin Basic Earning Power Return on Assets Return on Equity Market Value Ratios Earnings per share Price-to-earnings ratio Cash flow per share Price-to-cash flow ratio Book Value per share Market-to-book ratio e. Based on the above ratios, please answer the following questions 2002 i)Has Arora's liquidity position improved or worsened? Explain. ii) Has Arora's ability to manage assets improved or worsened? Explain. iii) How has Arora's profitability changed over the last year? iv) Perform an extended Du Pont analysis for Arora for 2001 and 2002. (2 Marks) (5 Marks) (1 Mark) (1 Mark) (1 Mark) (1 Mark)


