Answered step by step
Verified Expert Solution
Link Copied!

Question

1 Approved Answer

Assignment_3.txt date 1-Dec 2-Dec 5-Dec 9-Dec 10-Dec 19610131 0.058011 0.067392 0.081767 0.096754 0.087207 19610228 0.029241 0.042784 0.055524 0.056564 0.060245 19610330 0.025896 0.025474 0.041304 0.060563 0.071875
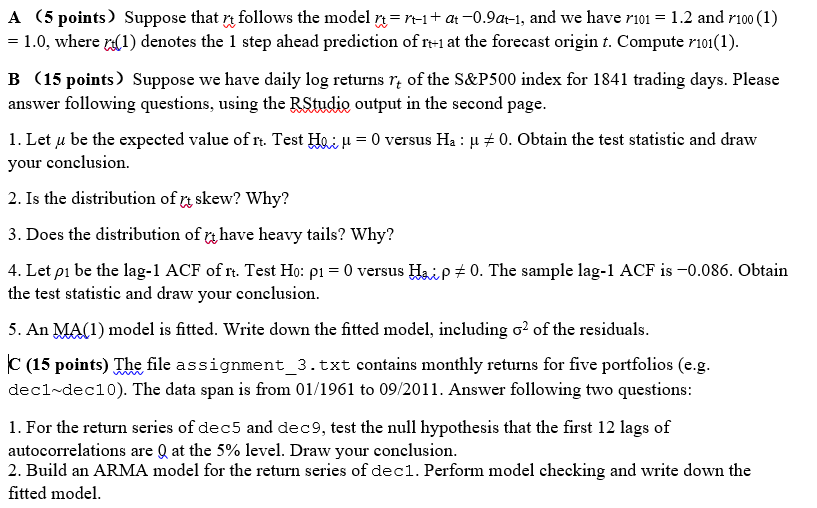
image text in transcribed

Assignment_3.txt

date 1-Dec 2-Dec 5-Dec 9-Dec 10-Dec
19610131 0.058011 0.067392 0.081767 0.096754 0.087207
19610228 0.029241 0.042784 0.055524 0.056564 0.060245
19610330 0.025896 0.025474 0.041304 0.060563 0.071875
19610428 0.005667 0.001365 0.00078 0.011911 0.023328
19610531 0.019208 0.036852 0.04959 0.046248 0.050362
19610630 -0.02467 -0.02523 -0.04005 -0.05065 -0.05143
19610731 0.035668 0.027452 0.00937 0.004484 -0.00896
19610831 0.024092 0.041437 0.015614 0.008745 0.011384
19610929 -0.01618 -0.02478 -0.01676 -0.03624 -0.03203
19611031 0.028087 0.028174 0.023155 0.023609 0.027843
19611130 0.048685 0.036955 0.043721 0.052817 0.048427
19611229 0.005025 -0.01109 -0.00404 0.002387 0.002329
19620131 -0.04526 -0.02255 -0.02908 0.007979 0.048003
19620228 0.02362 0.012706 0.015649 0.01248 0.027391
19620330 -0.0039 -0.00269 -0.00575 0.004284 -0.0071
19620430 -0.06129 -0.06965 -0.05903 -0.06924 -0.07276
19620531 -0.07885 -0.08584 -0.10734 -0.10079 -0.10835
19620629 -0.08326 -0.07597 -0.08563 -0.0798 -0.0753
19620731 0.068084 0.060073 0.051869 0.072275 0.077477
19620831 0.020698 0.02718 0.022439 0.036381 0.04777
19620928 -0.04482 -0.05854 -0.05907 -0.07738 -0.0736
19621031 0.012499 -0.00814 -0.01707 -0.05581 -0.05956
19621130 0.099604 0.133502 0.125354 0.129271 0.107458
19621231 0.019592 0.01113 -0.00794 -0.03834 -0.04075
19630131 0.045429 0.055389 0.066401 0.094983 0.104486
A (5 points) Suppose that nt follows the model n=rt-1+ at -0.9at-1, and we have r101 = 1.2 and r100 (1) = 1.0, where rt(1) denotes the 1 step ahead prediction of re-1 at the forecast origin t. Compute r101(1). B (15 points) Suppose we have daily log returns re of the S&P500 index for 1841 trading days. Please answer following questions, using the RStudio output in the second page. 1. Let u be the expected value of rt. Test Hai u = 0 versus Ha: u 0. Obtain the test statistic and draw your conclusion 2. Is the distribution of a skew? Why? 3. Does the distribution of r have heavy tails? Why? 4. Let pi be the lag-1 ACF of rt. Test Ho: p1 = 0 versus Haip *0. The sample lag-1 ACF is -0.086. Obtain the test statistic and draw your conclusion. 5. An MA(1) model is fitted. Write down the fitted model, including 02 of the residuals. C (15 points) The file assignment_3.txt contains monthly returns for five portfolios (e.g. deci-dec10). The data span is from 01/1961 to 09/2011. Answer following two questions: 1. For the return series of dec5 and dec9, test the null hypothesis that the first 12 lags of autocorrelations are l at the 5% level. Draw your conclusion. 2. Build an ARMA model for the return series of deci. Perform model checking and write down the fitted model. A (5 points) Suppose that nt follows the model n=rt-1+ at -0.9at-1, and we have r101 = 1.2 and r100 (1) = 1.0, where rt(1) denotes the 1 step ahead prediction of re-1 at the forecast origin t. Compute r101(1). B (15 points) Suppose we have daily log returns re of the S&P500 index for 1841 trading days. Please answer following questions, using the RStudio output in the second page. 1. Let u be the expected value of rt. Test Hai u = 0 versus Ha: u 0. Obtain the test statistic and draw your conclusion 2. Is the distribution of a skew? Why? 3. Does the distribution of r have heavy tails? Why? 4. Let pi be the lag-1 ACF of rt. Test Ho: p1 = 0 versus Haip *0. The sample lag-1 ACF is -0.086. Obtain the test statistic and draw your conclusion. 5. An MA(1) model is fitted. Write down the fitted model, including 02 of the residuals. C (15 points) The file assignment_3.txt contains monthly returns for five portfolios (e.g. deci-dec10). The data span is from 01/1961 to 09/2011. Answer following two questions: 1. For the return series of dec5 and dec9, test the null hypothesis that the first 12 lags of autocorrelations are l at the 5% level. Draw your conclusion. 2. Build an ARMA model for the return series of deci. Perform model checking and write down the fitted model

Step by Step Solution

There are 3 Steps involved in it

Step: 1

blur-text-image

Get Instant Access to Expert-Tailored Solutions

See step-by-step solutions with expert insights and AI powered tools for academic success

Step: 2

blur-text-image

Step: 3

blur-text-image

Ace Your Homework with AI

Get the answers you need in no time with our AI-driven, step-by-step assistance

Get Started

Recommended Textbook for

More Books

Students also viewed these Finance questions

Question

Describe the relationship between annual objectives and policies.

Answered: 1 week ago