Assignments X Take a Test - Genesis Quezada X Z Critical Value Calculator x Course Hero X + C mathxl.com/Student/PlayerTest.aspx?testid=232316946¢erwin=yes Apps Other Bookmarks Reading List
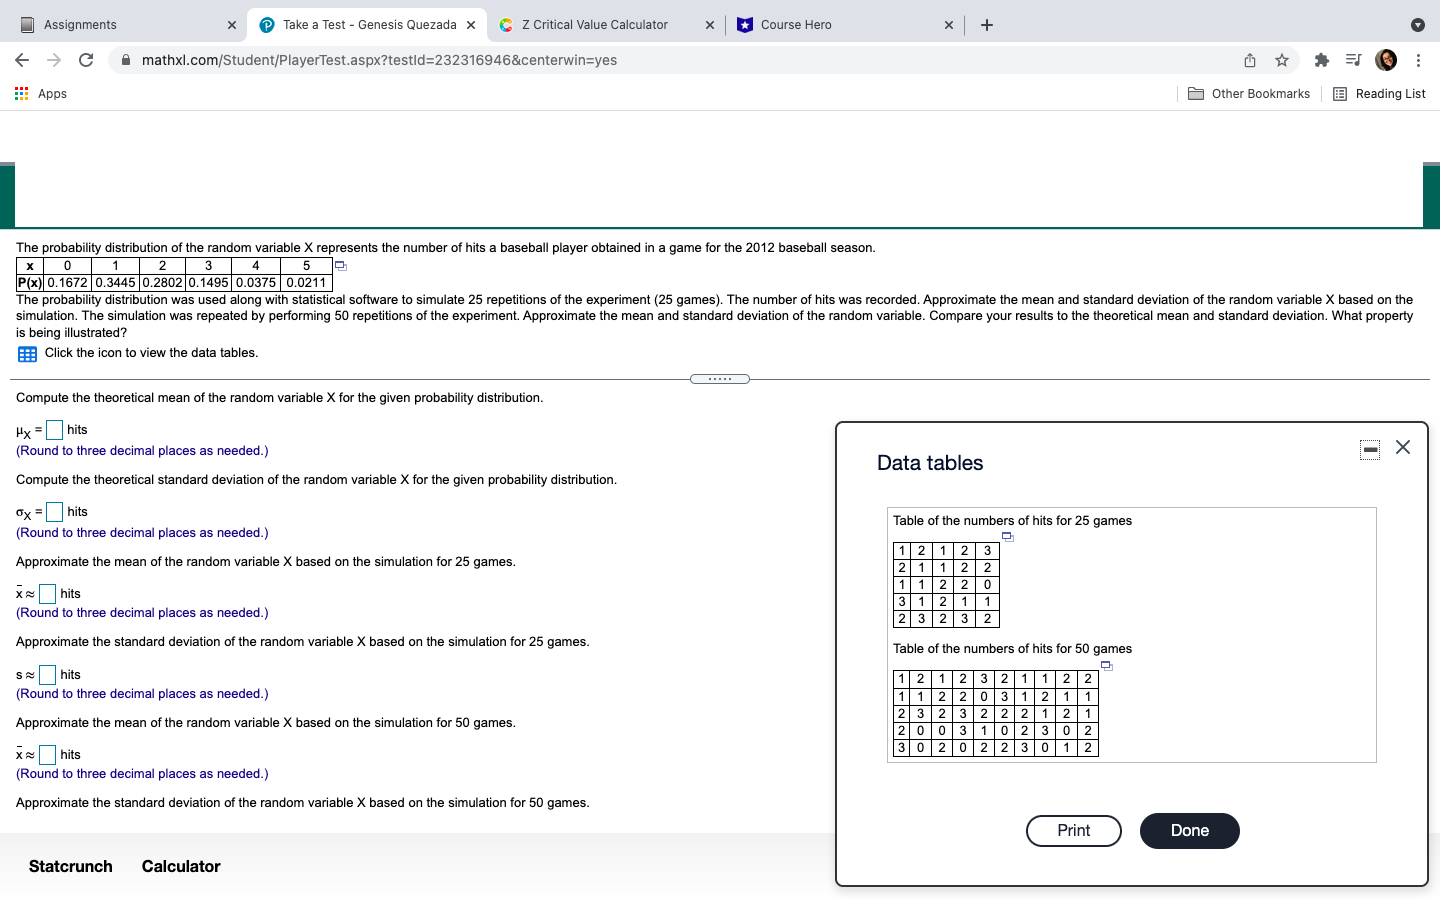
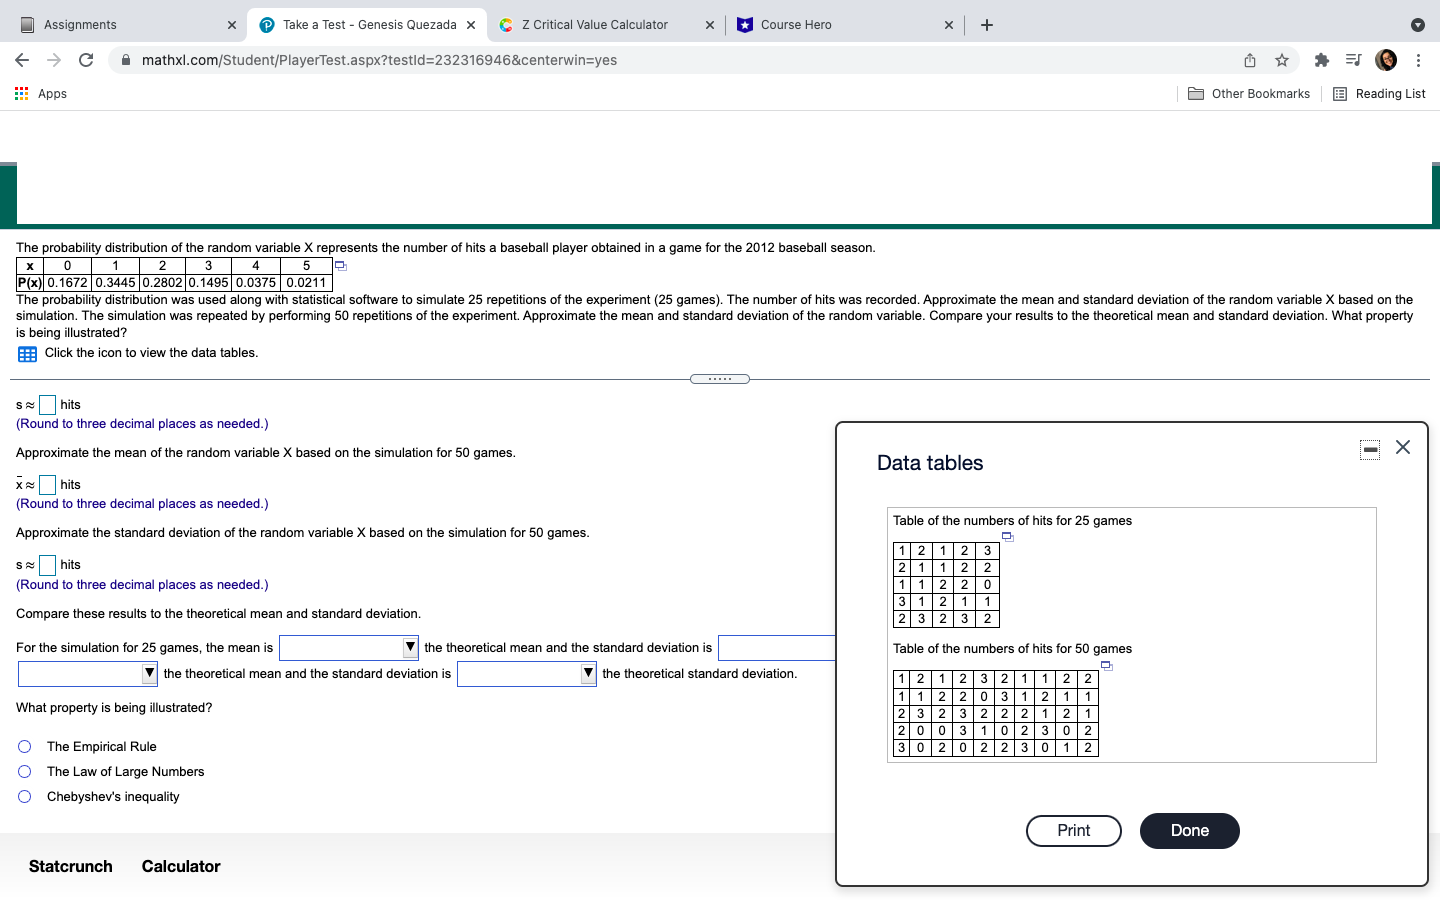
Assignments X Take a Test - Genesis Quezada X Z Critical Value Calculator x Course Hero X + C mathxl.com/Student/PlayerTest.aspx?testid=232316946¢erwin=yes Apps Other Bookmarks Reading List The probability distribution of the random variable X represents the number of hits a baseball player obtained in a game for the 2012 baseball season. x 0 1 2 3 4 5 3 P(x) 0.1672 0.3445 0.2802 0.1495 0.0375 0.0211 The probability distribution was used along with statistical software to simulate 25 repetitions of the experiment (25 games). The number of hits was recorded. Approximate the mean and standard deviation of the random variable X based on the simulation. The simulation was repeated by performing 50 repetitions of the experiment. Approximate the mean and standard deviation of the random variable. Compare your results to the theoretical mean and standard deviation. What property is being illustrated? Click the icon to view the data tables. Compute the theoretical mean of the random variable X for the given probability distribution. Hx = hits (Round to three decimal places as needed.) X Data tables Compute the theoretical standard deviation of the random variable X for the given probability distribution. ox = hits Table of the numbers of hits for 25 games (Round to three decimal places as needed.) 12 1 2 3 Approximate the mean of the random variable X based on the simulation for 25 games. 2 1 1 2 2 x |hits 1 1 2 2 0 (Round to three decimal places as needed.) 3 1 2 1 1 2 3 2 3 2 Approximate the standard deviation of the random variable X based on the simulation for 25 games. Table of the numbers of hits for 50 games s hits 1 2 1 2 3 2 1 1 2 2 (Round to three decimal places as needed.) 1 1 2 2 0 3 1 2 1 1 Approximate the mean of the random variable X based on the simulation for 50 games. 2 3 2 3 2 2 2 1 2 1 20 0 3 10 2 3 0 2 x hits 3 0 2 0 2 2 3 0 1 2 (Round to three decimal places as needed.) Approximate the standard deviation of the random variable X based on the simulation for 50 games. Print Done Statcrunch CalculatorAssignments X Take a Test - Genesis Quezada X Z Critical Value Calculator x Course Hero X + mathxl.com/Student/PlayerTest.aspx?testld=232316946¢erwin=yes Apps Other Bookmarks Reading List The probability distribution of the random variable X represents the number of hits a baseball player obtained in a game for the 2012 baseball season. x 0 1 2 3 4 5 9 P(x) 0.1672 0.3445 0.2802 0.1495 0.0375 0.0211 The probability distribution was used along with statistical software to simulate 25 repetitions of the experiment (25 games). The number of hits was recorded. Approximate the mean and standard deviation of the random variable X based on the simulation. The simulation was repeated by performing 50 repetitions of the experiment. Approximate the mean and standard deviation of the random variable. Compare your results to the theoretical mean and standard deviation. What property is being illustrated? Click the icon to view the data tables. s hits (Round to three decimal places as needed.) Approximate the mean of the random variable X based on the simulation for 50 games. X Data tables x hits (Round to three decimal places as needed.) Table of the numbers of hits for 25 games Approximate the standard deviation of the random variable X based on the simulation for 50 games. 12 1 2 3 S hits 2 1 1 2 2 (Round to three decimal places as needed.) 1 1 2 2 0 3 1 2 1 1 Compare these results to the theoretical mean and standard deviation. 2 3 2 3 2 For the simulation for 25 games, the mean is the theoretical mean and the standard deviation is Table of the numbers of hits for 50 games the theoretical mean and the standard deviation is the theoretical standard deviation. 1 2 1 2 3 2 1 1 2 2 What property is being illustrated? 1 1 2 2 0 3 1 2 1 1 2 3 2 3 2 2 2 1 2 1 2 0 0 3 10 2 3 0 2 O The Empirical Rule 3 0 2 0 2 2 3 0 1 2 O The Law of Large Numbers O Chebyshev's inequality Print Done Statcrunch Calculator
Step by Step Solution
There are 3 Steps involved in it
Step: 1
Get Instant Access to Expert-Tailored Solutions
See step-by-step solutions with expert insights and AI powered tools for academic success
Step: 2
Step: 3
Ace Your Homework with AI
Get the answers you need in no time with our AI-driven, step-by-step assistance