Answered step by step
Verified Expert Solution
Question
1 Approved Answer
ASSINMENT 2 - Data Visualization with Tableau ( ( ( ( I NEED THE ANSWER NOT THE STEPS : SOMEONE TO SOLVE IT ) )
ASSINMENT Data Visualization with Tableau I NEED THE ANSWER NOT THE STEPS : SOMEONE TO SOLVE IT
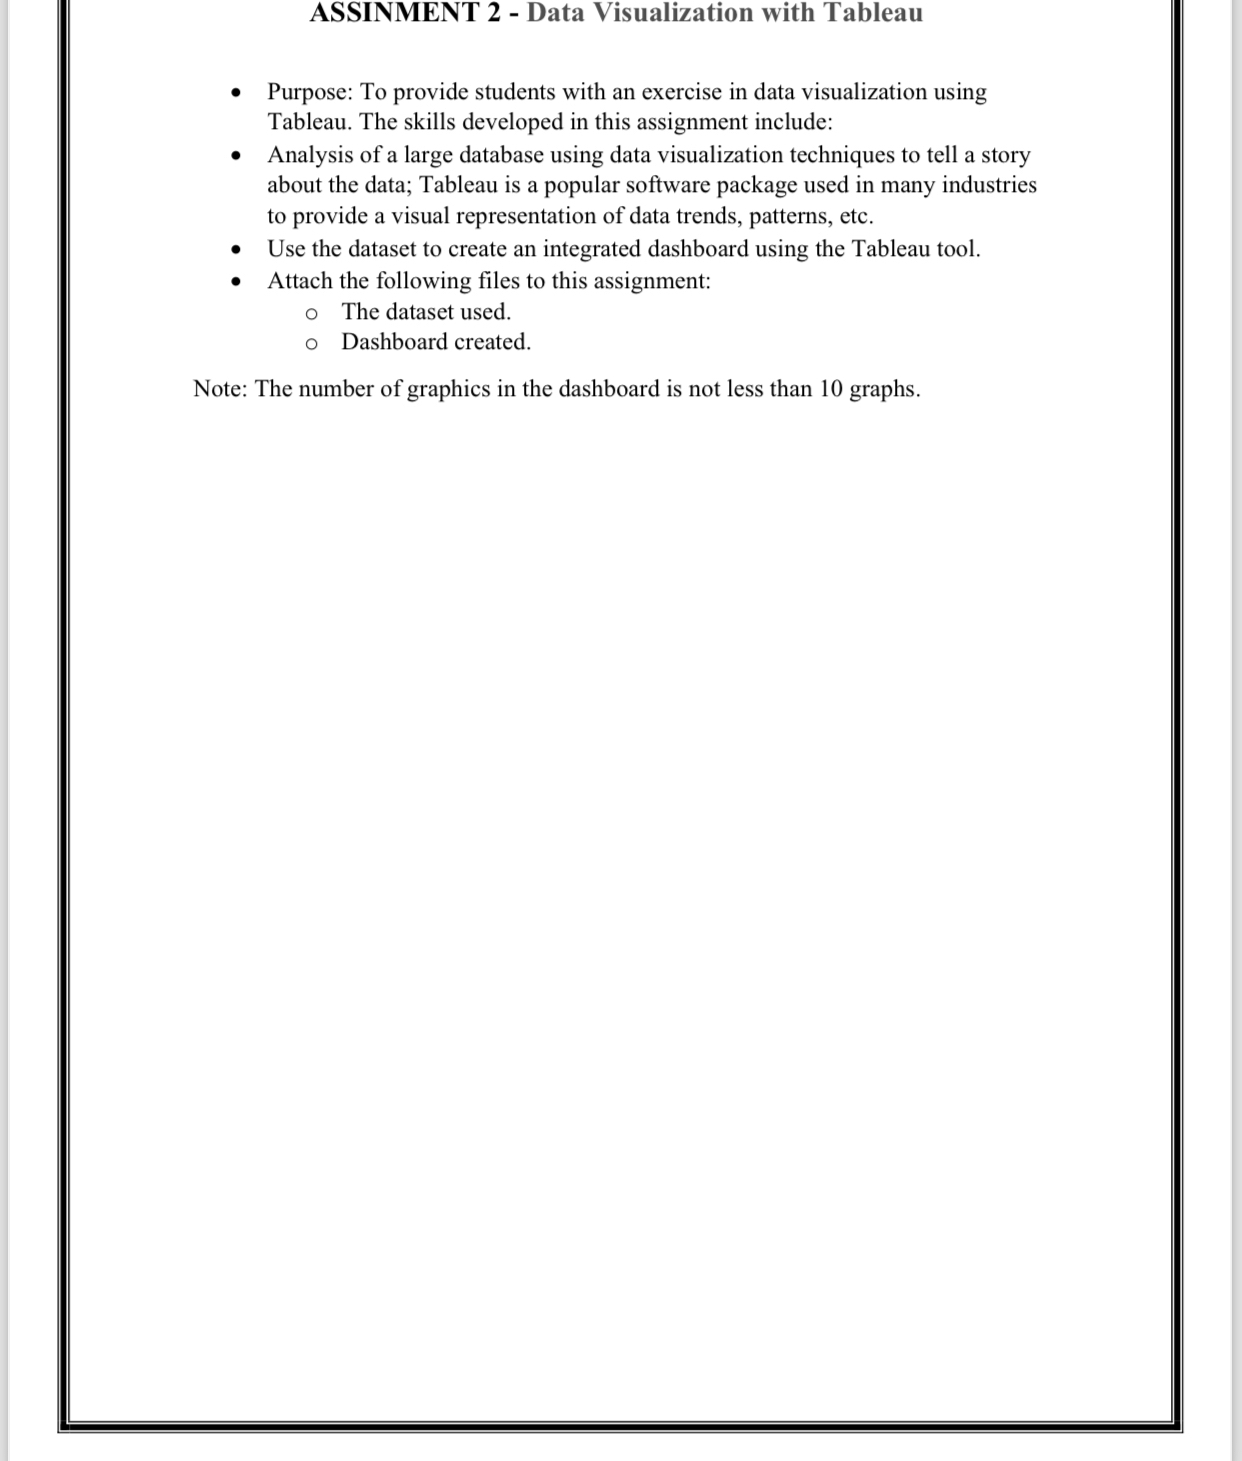
Purpose: To provide students with an exercise in data visualization using Tableau. The skills developed in this assignment include:
Analysis of a large database using data visualization techniques to tell a story about the data; Tableau is a popular software package used in many industries to provide a visual representation of data trends, patterns, etc.
Use the dataset to create an integrated dashboard using the Tableau tool.
Attach the following files to this assignment:
The dataset used.
Dashboard created.
Note: The number of graphics in the dashboard is not less than graphs.
I want the answer not the not the way or the steps

Step by Step Solution
There are 3 Steps involved in it
Step: 1

Get Instant Access to Expert-Tailored Solutions
See step-by-step solutions with expert insights and AI powered tools for academic success
Step: 2

Step: 3

Ace Your Homework with AI
Get the answers you need in no time with our AI-driven, step-by-step assistance
Get Started


