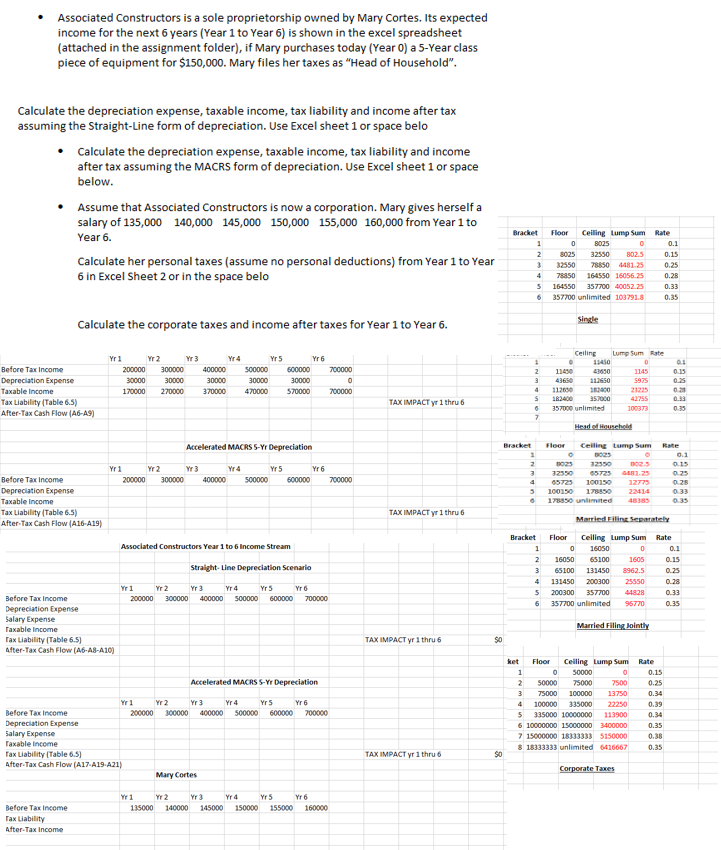
Associated Constructors is a sole proprietorship owned by Mary Cortes. Its expected income for the next 6 years (Year 1 to Year 6) is shown in the excel spreadsheet (attached in the assignment folder), if Mary purchases today (Year 0) a 5-Year class piece of equipment for $150,000. Mary files her taxes as "Head of Household Calculate the depreciation expense, taxable income, tax liability and income after tax assuming the Straight-Line form of depreciation. Use Excel sheet 1 or space belo Calculate the depreciation expense, taxable income, tax liability and income after tax assuming the MACRS form of depreciation. Use Excel sheet 1 or space below e Assume that Associated Constructors is now a corporation. Mary gives herself a salary of 135,000 140,000 145,000 150,000 155,000 160,000 from Year 1 to Year 6. Bracket Floor Ceilling Lump Sum Rate 0 8025 2 8025 32550 802.5 0.15 0.25 Calculate her personal taxes (assume no personal deductions) from Year 1 to Year 6 in Excel Sheet 2 or in the space belo 32550 8850 4481 25 6 357700 unlimited 103791.80.35 Calculate the corporate taxes and income after taxes for Year 1 to Year 6. Celling Lump Sum Rate Yr 6 Before Tax Income Depreciation Expense Taxable Income Tax Liability (Table 65) After-Tax Cash Flow (A6-AS) 00000 300000 400000 500000 600000 700000 2 11430 112600 2820021225 S 182400 357000 6 357000 unlimited 170000 270000 370000 4700070000 700000 AX IMPACT yr 1 thru Accelerated MACRS S-Yr Depreciation Bracket Floo Celiling ump Sum Rate 0O23235 023 0.15 Yr 2 00000 300000 Yr 6 Before Tax Income Depreciation Expense Taxable Income Tax Liability (Table 6.5) After-Tax Cash Flow (A16A19) 400000 500000 600000 700000 178830 unimited 48383 TAX IMPACT yr 1 thru 6 Bracket Floor Celling Lump Sum Rate 0 16050 Associated Constructors Year 1 to 6 Income Stream 0.1 2 16050 651001605 015 3 65100 131450 8962.5025 4 131450 200300 25550 5 200300 357700 44828033 6 357700 unlimited 95770035 Straight- Line Depreciation Scenario Before Tax Income Depreciation Expense alary Expense Taxable Income Tax Liability (Table 6.5 After-Tax Cash Flow (A6-A8-A10) TAX IMPACT yr 1 thru 6 ket Floor Ceiling Lump Sum Rate 0.15 0.25 Accelerated MACRS S-Yr Depreciation 250000 5000 7500 4 100000 335000 22250 5 335000 10000000 113900 0.39 0.34 Before Tax Income Depreciation Expense alary Expense Taxable Income Tax Liability (Table 6.5) After-Tax Cash Flow (A17-A19 A21) 200000 300000 400000 500000 600000 700000 15000000 18333333 5150000 8 18333333 unlimited 416667 0.38 0.35 TAX IMPACT yr 1 thru S0 Mary Cortes Yr 1 Yr 2 Before Tax income Tax Liability After-Tax Income 35000 140000 145000 150000 155000 160000