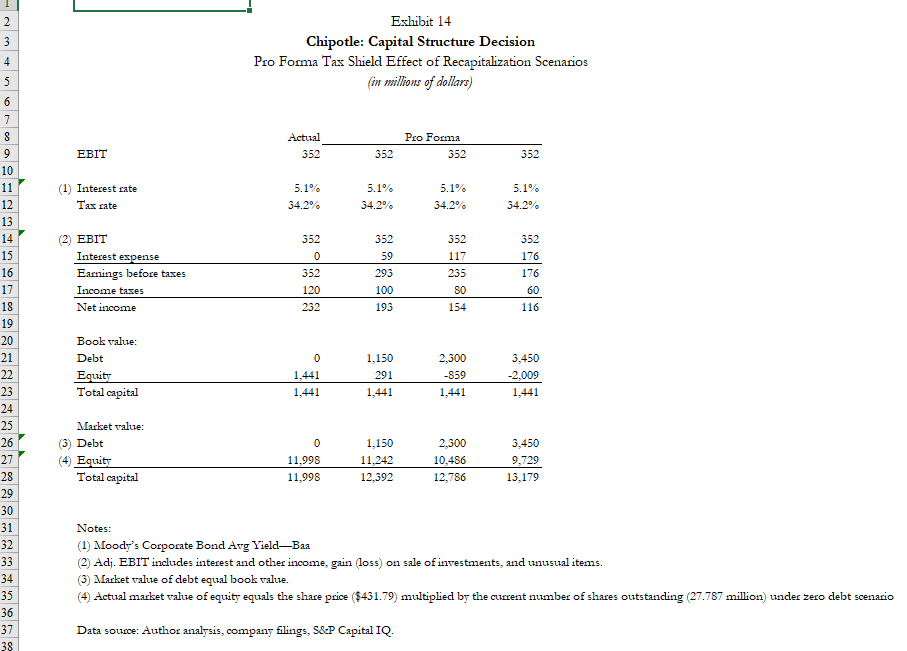
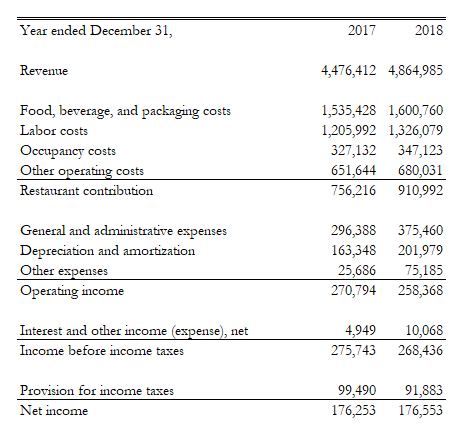
Assume 3 possible debt levels given in the case, as well as no debt. Debt will be used to repurchase shares at premiums of 5%, 10% and 20% to prevailing market price. In order to calculate resources available for share repurchases, start with net income using unadjusted EBIT then add depreciation and amortization. Assume existing cash in the balance sheet will not be used for share repurchases. Note that the student spreadsheet has been revised to use unadjusted EBIT for net income estimates (this assumes that there is no interest income for the existing cash balance). Please generate your own estimate of uses of resources. Assume no additional working capital requirements.
Calculate and explain movements in EPS, return on (book) equity, return on total (book) capital, earnings available to security holders and cash payments to security holders across the zero and three debt levels. If needed, please assume that the share repurchase price will be the prevailing market price after repurchases are completed for simplicity (in MV equity estimations).
What conclusions can your draw from this base case analysis?


2 3 Exhibit 14 Chipotle: Capital Structure Decision Pro Forma Tax Shield Effect of Recapitalization Scenarios (in millions of dollars) 4 5 6 7 8 Actual Pro Forma 9 EBIT 352 352 352 352 10 11 5.1% 5.1% 5.1% (1) Interest rate Tax rate 5.1% 34.2% 12 34.2% 34.2% 34.2% 13 14 EBIT 352 352 352 352 15 0 59 117 176 16 352 293 235 176 Interest expense Earnings before taxes Income taxes Net income 17 120 100 80 60 18 232 193 154 116 19 20 Book value: 21 Debt 0 1,150 2,300 22 291 -859 Equity Total capital 1,441 1,441 3,450 -2,009 1,441 23 1,441 1,441 24 25 Market value: 26 0 1,150 3,450 27 (3) Debt (4) Equity Total capital 11.242 2,300 10,486 12,786 11,998 11,998 9.729 28 12,392 13,179 29 30 31 Notes: 32 33 34 (1) Moody's Corporate Bond Avg YieldBaa (2) Adj. EBIT includes interest and other income, gain (loss) on sale of investments, and unusual items. (3) Market value of debt equal book value. (4) Actual market value of equity equals the share price ($431.79) multiplied by the current number of shares outstanding (27.787 million) under zero debt scenario 35 36 37 Data source: Author analysis, company filings, S&P Capital IQ. 38 Year ended December 31, 2017 2018 Revenue 4,476,412 4,864,985 Food, beverage, and packaging costs Labor costs Occupancy costs Other operating costs Restaurant contribution 1,535,428 1,600,760 1,205,992 1,326,079 327,132 347,123 651,644 680,031 756,216 910,992 General and administrative expenses Depreciation and amortization Other expenses Operating income 296,388 375,460 163,348 201,979 25,686 75,185 270,794 258,368 Interest and other income (expense), net 4,949 10,068 275,743 268,436 Income before income taxes Provision for income taxes Net income 99,490 176,253 91,883 176,553 2 3 Exhibit 14 Chipotle: Capital Structure Decision Pro Forma Tax Shield Effect of Recapitalization Scenarios (in millions of dollars) 4 5 6 7 8 Actual Pro Forma 9 EBIT 352 352 352 352 10 11 5.1% 5.1% 5.1% (1) Interest rate Tax rate 5.1% 34.2% 12 34.2% 34.2% 34.2% 13 14 EBIT 352 352 352 352 15 0 59 117 176 16 352 293 235 176 Interest expense Earnings before taxes Income taxes Net income 17 120 100 80 60 18 232 193 154 116 19 20 Book value: 21 Debt 0 1,150 2,300 22 291 -859 Equity Total capital 1,441 1,441 3,450 -2,009 1,441 23 1,441 1,441 24 25 Market value: 26 0 1,150 3,450 27 (3) Debt (4) Equity Total capital 11.242 2,300 10,486 12,786 11,998 11,998 9.729 28 12,392 13,179 29 30 31 Notes: 32 33 34 (1) Moody's Corporate Bond Avg YieldBaa (2) Adj. EBIT includes interest and other income, gain (loss) on sale of investments, and unusual items. (3) Market value of debt equal book value. (4) Actual market value of equity equals the share price ($431.79) multiplied by the current number of shares outstanding (27.787 million) under zero debt scenario 35 36 37 Data source: Author analysis, company filings, S&P Capital IQ. 38 Year ended December 31, 2017 2018 Revenue 4,476,412 4,864,985 Food, beverage, and packaging costs Labor costs Occupancy costs Other operating costs Restaurant contribution 1,535,428 1,600,760 1,205,992 1,326,079 327,132 347,123 651,644 680,031 756,216 910,992 General and administrative expenses Depreciation and amortization Other expenses Operating income 296,388 375,460 163,348 201,979 25,686 75,185 270,794 258,368 Interest and other income (expense), net 4,949 10,068 275,743 268,436 Income before income taxes Provision for income taxes Net income 99,490 176,253 91,883 176,553


