Answered step by step
Verified Expert Solution
Question
1 Approved Answer
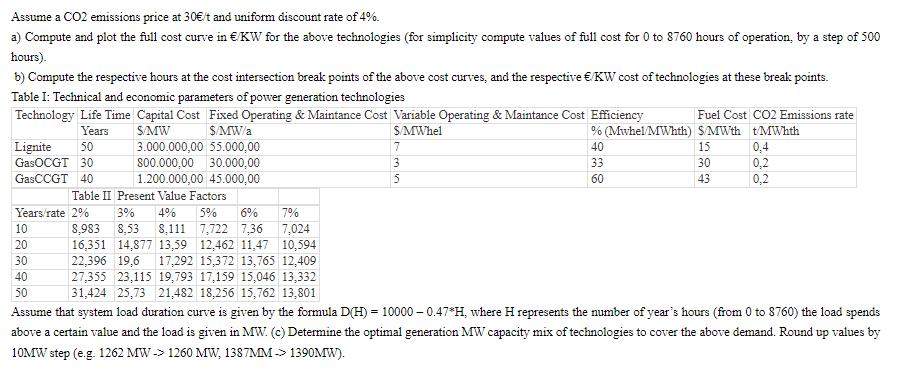
Assume a CO2 emissions price at 30/t and uniform discount rate of 4%. a) Compute and plot the full cost curve in /KW for

Assume a CO2 emissions price at 30/t and uniform discount rate of 4%. a) Compute and plot the full cost curve in /KW for the above technologies (for simplicity compute values of full cost for 0 to 8760 hours of operation, by a step of 500 hours). b) Compute the respective hours at the cost intersection break points of the above cost curves, and the respective /KW cost of technologies at these break points. Table I: Technical and economic parameters of power generation technologies Technology Life Time Capital Cost Fixed Operating & Maintance Cost Variable Operating & Maintance Cost Efficiency Years S/MW S/MW/a S/MWhel 7 Lignite 50 GasOCGT 30 GasCCGT 40 Years/rate 2% 3.000.000,00 55.000,00 800.000,00 30.000,00 1.200.000,00 45.000,00 10 20 30 40 50 35 Fuel Cost CO2 Emissions rate % (Mwhel/MWhth) S/MWth t/MWhth 40 33 60 15 30 43 Table II Present Value Factors 3% 4% 5% 6% 7% 8,983 8,53 8,111 7,722 7,36 7,024 16,351 14,877 13,59 12,462 11,47 10,594 22,396 19,6 17,292 15,372 13,765 12,409 27,355 23,115 19,793 17,159 15,046 13,332 31,424 25,73 21,482 18,256 15,762 13,801 Assume that system load duration curve is given by the formula D(H) = 10000-0.47*H, where H represents the number of year's hours (from 0 to 8760) the load spends above a certain value and the load is given in MW. (c) Determine the optimal generation MW capacity mix of technologies to cover the above demand. Round up values by 10MW step (e.g. 1262 MW 1260 MW, 1387MM 1390MW). 0,4 0,2 0,2
Step by Step Solution
★★★★★
3.45 Rating (152 Votes )
There are 3 Steps involved in it
Step: 1

Get Instant Access to Expert-Tailored Solutions
See step-by-step solutions with expert insights and AI powered tools for academic success
Step: 2

Step: 3

Ace Your Homework with AI
Get the answers you need in no time with our AI-driven, step-by-step assistance
Get Started


