Answered step by step
Verified Expert Solution
Question
1 Approved Answer
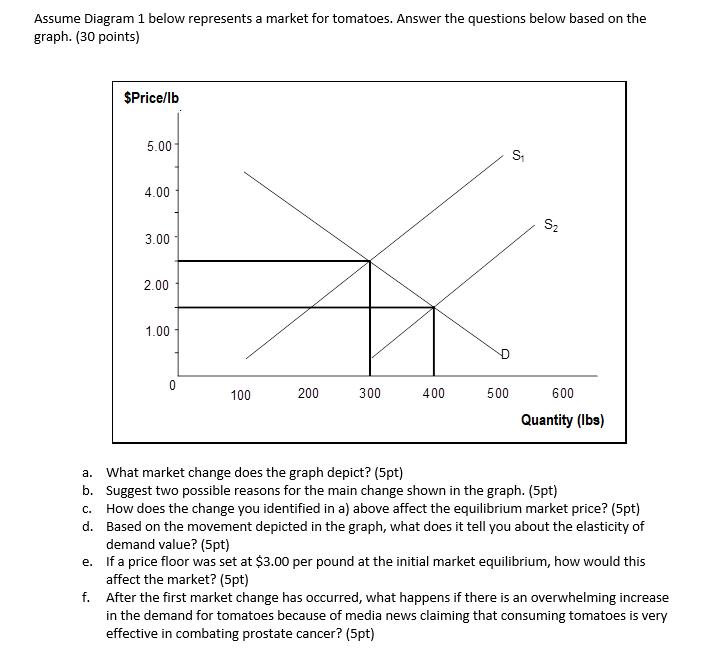
Assume Diagram 1 below represents a market for tomatoes. Answer the questions below based on the graph. (30 points) $Price/lb 5.00 4.00 3.00 2.00

Assume Diagram 1 below represents a market for tomatoes. Answer the questions below based on the graph. (30 points) $Price/lb 5.00 4.00 3.00 2.00 1.00 0 100 200 300 400 500 S S 600 Quantity (lbs) a. What market change does the graph depict? (5pt) b. Suggest two possible reasons for the main change shown in the graph. (5pt) c. How does the change you identified in a) above affect the equilibrium market price? (5pt) Based on the movement depicted in the graph, what does it tell you about the elasticity of demand value? (5pt) d. e. If a price floor was set at $3.00 per pound at the initial market equilibrium, how would this affect the market? (5pt) f. After the first market change has occurred, what happens if there is an overwhelming increase in the demand for tomatoes because of media news claiming that consuming tomatoes is very effective in combating prostate cancer? (5pt)
Step by Step Solution
★★★★★
3.50 Rating (170 Votes )
There are 3 Steps involved in it
Step: 1
a What market change does the graph depict 5pt The graph depicts a decrease in the market price of tomatoes from 15 per with a corresponding increase ...
Get Instant Access to Expert-Tailored Solutions
See step-by-step solutions with expert insights and AI powered tools for academic success
Step: 2

Step: 3

Ace Your Homework with AI
Get the answers you need in no time with our AI-driven, step-by-step assistance
Get Started


