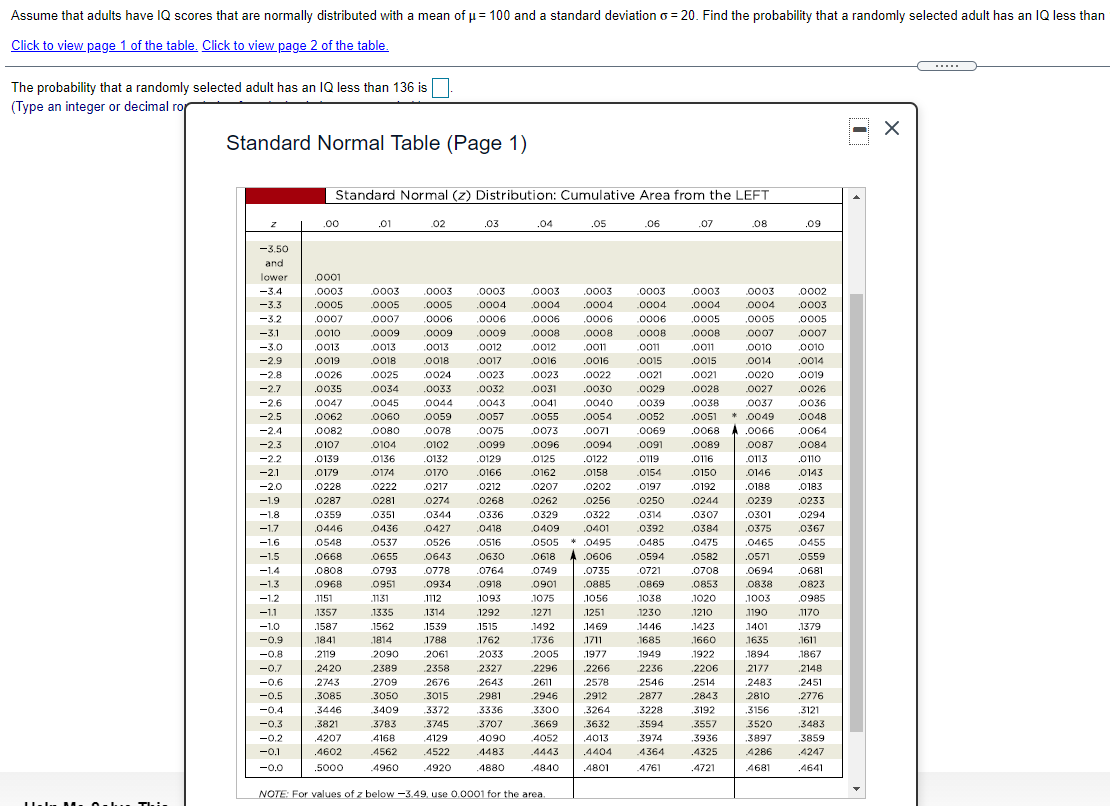
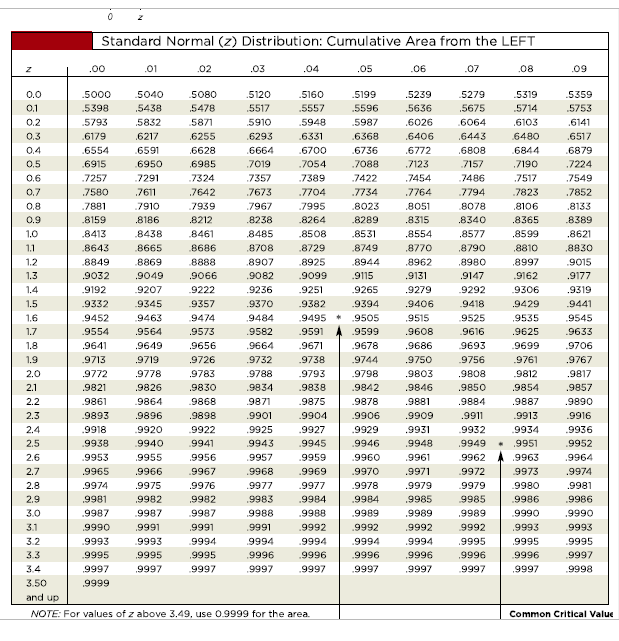
Assume that adults have 10 scores that are normally distributed with a mean of p: 101] and a standard deviation 0 =20. Find the probability that a randomly seleded adult has an IQ less than Click to View page 1 of the table. Click to view page 2 of the table. The probability that a randome selected adult has an IQ less than 136 is (Type an integer or decimal ro Standard Normal Table (Page 1) _ Standard Normal (2) Distribution: Cumulative Area from the LEFT I .00 .01 .02 .03 .04 .05 .06 .02 .03 -3.50 and lmr .0001 3.4 .0003 .0003 .0003 .0003 .0 003 .0003 -5.3 .0005 .0005 .0005 .0004 .0004 .0004 -3.2 .0002 .0002 .0006 .0006 .0 006 .0006 3.1 .0010 .0000 .0008 .0009 .0008 .0008 3.0 .0013 .0013 .0013 .0012 .0 012 .0011 23 .0019 .0018 .0018 .0012 .0016 .0016 2.8 .0026 .0025 .0024 .0023 .0 023 .0022 -2.2 .0035 .0034 .0053 .0052 .0051 .0030 -2.6 .0042 .0045 .0044 .0043 .0 041 .0040 25 .0062 .0060 .0059 .0057 .0055 .0054 .0052 2.4 .0082 .0080 .0023 .0025 .0 023 .0021 .0069 23 .0102 .0104 .0102 .0099 .0096 .0094 .0091 2.2 .0139 .0136 .0152 .0129 .0125 .0122 .0119 2.'| .0129 .0124 .0120 .0166 .0162 .0153 .0154 2.0 .0223 .0222 .0212 .0212 .0202 .0202 .0192 1.9' .0282 .0281 .0224 .0268 .0262 .0256 .0250 1.8 .0359 .0351 .0344 .0336 .0 329 .0322 .0314 1.2 .0446 .0436 .0422 .0416 .0403 .0401 .0392 1.5 .0546 .0532 .0525 .0516 )0 505 * .0495 .0465 -1.5 .0663 .0655 .0643 .0630 .0616 i .0606 .0594 1.4 .0806 .0293 .0223 .0264 .0249 .0235 .0221 1.3 .0968 .0951 .0934 .0918 .0901 .085 .0859 1.2 .1151 .1131 .1112 .1093 .1025 .1056 .1033 1.1 .1352 .1335 .1314 .1202 .1221 .1251 .1230 1.0 .1582 .1562 .1535 .1515 .1452 .1453 .1445 -0.9 .1841 .1814 .1288 .1262 .1236 .1211 .1685 0.8 .2110 .2090 .2061 .2033 .2005 .1922 .1949 0.2 .2420 .2389 .2558 .2322 .2296 .2266 .2236 0.6 .2243 .2209 .2626 .2643 .2611 .2528 2546 -0.5 .3085 .3050 .5015 .2881 .2846 .2912 .2822 -0.4 .3446 .3408 .3322 .3336 .3300 .3264 .3228 -0.3 .3821 .3283 .3245 .3202 .3559 .3632 .3594 0.2 .4202 .4168 .4129 .4090 .4052 .4013 .3924 D.1 .4602 .4562 .4522 .4483 .4443 .4404 .4364 0.0 .5000 .4960 .4920 .4880 .4840 .4801 .4261 NOTE For values at new -149 use 0 0001 fer the area II_I_ u. n_l.._ 11:. Standard Normal (2) Distribution: Cumulative Area from the LEFT 02 .03 .04 .05 .OE 07 08 109 0.0 5000 5040 5080 5120 5160 .5199 5239 5279 5319 5359 0.1 .5398 5438 5478 5517 .5557 5596 5636 5675 5714 5753 0.2 5795 5832 5871 5910 .5948 5987 6026 6064 6103 .6141 0.3 6179 621 6255 6293 6331 6368 6406 6443 6480 6517 0.4 6554 6591 .6628 6664 6700 6736 6772 6808 6844 6879 0,5 6915 6950 6985 7019 7054 7088 7123 7157 7190 7224 0.6 7257 7291 7324 7357 7389 7422 .7454 7486 .7517 7549 0.7 .7580 .7611 .7642 7673 7704 7734 .7764 7794 7823 .7852 .7887 7910 7939 7967 7995 8023 8051 8078 .8106 8133 0.8 0.9 8159 .8186 .8212 8238 8264 8289 .8315 8340 8365 .8389 1.0 8413 8438 8461 8485 8508 8531 8554 .8577 8599 8621 1,1 8643 8665 8686 8708 8729 8749 8770 8790 8810 8830 1.2 .8849 8869 8888 8907 8925 8944 .8962 8980 8997 9015 1.3 9032 9049 .9066 9082 9099 9115 9131 9147 9162 9177 9192 9207 9222 9236 9251 9265 9279 9292 9306 9319 1.4 1.5 9332 9345 9357 9370 9382 9394 9406 9418 9429 9441 1.6 9452 9463 9474 9484 9495 9505 9515 9525 9535 9545 9554 9564 9573 9582 9591 9599 9608 9616 9625 9633 1.7 .9641 .9649 9656 9664 9671 9678 9686 9693 9699 9706 1.8 1.9 9713 9719 9726 9732 9738 9744 9750 9756 9761 9767 2.0 9772 9778 9783 9788 9793 9798 9803 .9808 9812 .9817 2.1 .9821 9826 9830 9834 9836 9842 9846 9850 9854 .9857 2.2 9861 9864 9868 9871 9875 9878 9881 .9884 9887 .9890 2.3 .9893 9896 9898 9901 9904 .9906 9909 9911 9913 9916 2.4 9918 9920 9922 9925 9927 .9929 9931 9932 9934 9936 2.5 9938 9940 9941 9943 9945 9946 9948 9949 9951 9952 2.6 9953 9955 9956 9957 9959 9960 9961 9962 9963 9964 2.7 9965 9966 .9967 9968 9969 9970 9971 9972 9973 .9974 2.8 .9974 .9975 9976 9977 9977 9978 .9979 9979 9980 .9981 2.9 9981 .9982 9982 9983 9984 9984 .9985 9985 9986 .9986 30 9987 9987 9987 9988 9988 9989 9989 9989 9990 ,9990 3.1 9990 9991 9991 9991 9992 9992 .9992 9992 9993 9993 3.2 9993 9993 .9994 .9994 1666 9994 9994 9995 9995 9995 3 3 9995 9995 9995 9996 9996 9996 9996 9996 9996 9997 3.4 9997 9997 9997 9997 9997 9997 9997 9997 .9997 9998 3 50 9999 and up NOTE: For values of z above 3.49, use 09999 for the area. Common Critical Value