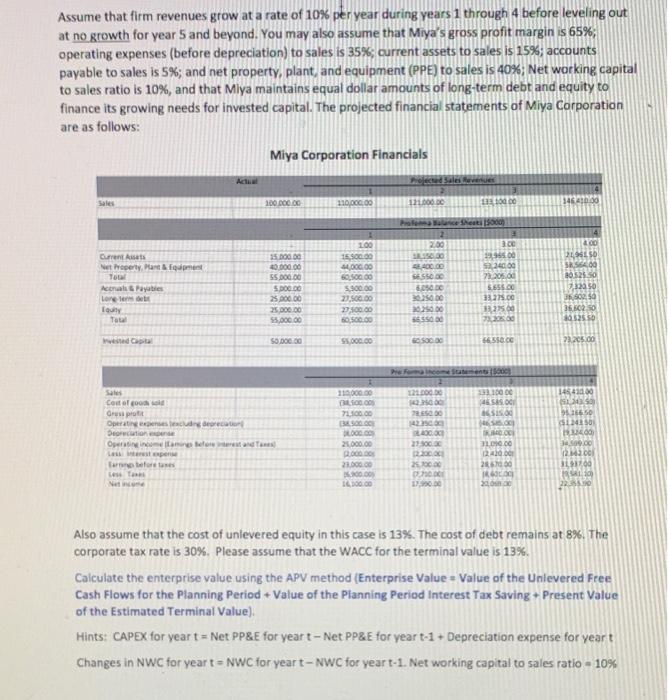
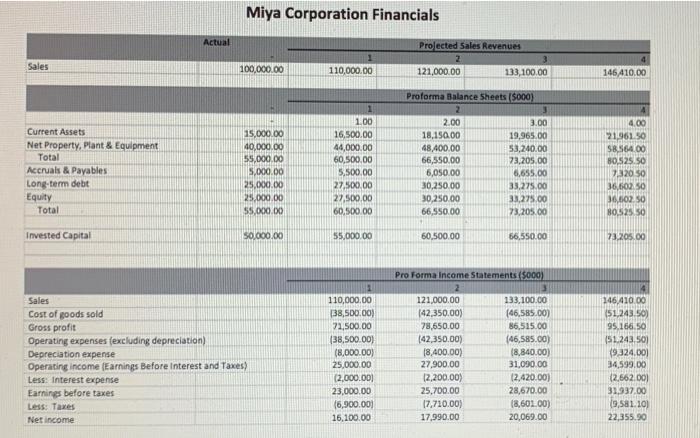
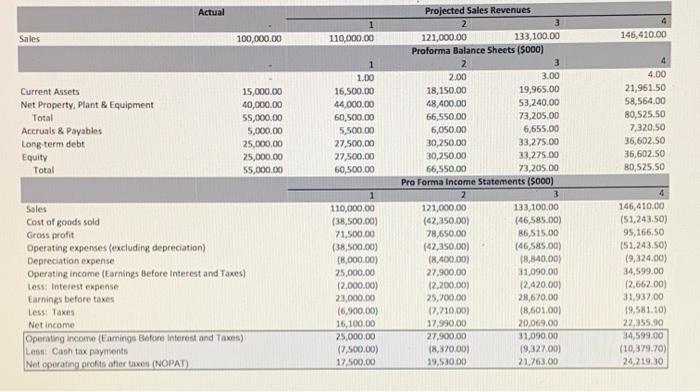
Assume that firm revenues grow at a rate of 10% per year during years 1 through 4 before leveling out at no growth for year 5 and beyond. You may also assume that Miya's gross profit margin is 65%; operating expenses (before depreciation) to sales is 35%; current assets to sales is 15%; accounts payable to sales is 5%; and net property, plant, and equipment (PPE) to sales is 40%; Net working capital to sales ratio is 10%, and that Miya maintains equal dollar amounts of long-term debt and equity to finance its growing needs for invested capital. The projected financial statements of Miya Corporation are as follows: Miya Corporation Financials Acta Sales 100 DOO 00 110,000 1.000.00 111000 34600 Protesti 300 31,50 Current sets Netheperty, partim Total en Payables Lorele 2.00 0.00 SOLD SESSO 3500.00 10.000.00 55.000.00 SO DE 25 200.00 25 000.00 5.000.00 200 15,900.00 G. Sood 5.900.00 27.500.00 20.100.00 6.500 23.00 7320500 5.655. 33.275.00 275.00 2025000 20.250 50 od 20525.50 332050 000 36 502 50 $6325.50 Total West Capital 50.000 SS 00.00 SO HO Prements 5000 115,000.00 TMO DE Sales Corto con Grupo Operating corecar Doctor Opera nestand 100 OC 46 ISO S. HO DO 72,100.00 B000 B. 2.000.00 2.000 21.000.00 200.00 20 142350.00 200.00 2350 122300 2. 981565 52450 140 .. Tarnobre Le 12.40 267000 100 1100 11 225 Also assume that the cost of unlevered equity in this case is 13%. The cost of debt remains at 8%. The corporate tax rate is 30%. Please assume that the WACC for the terminal value is 13%. Calculate the enterprise value using the APV method (Enterprise Value = Value of the Unievered Free Cash Flows for the Planning Period + Value of the Planning Period interest Tax Saving Present Value of the Estimated Terminal Value) Hints: CAPEX for yeart - Net PP&E for year t-Net PP&E for yeart-1 + Depreciation expense for yeart Changes in NWC for yeart - NWC for year t-NWC for year t-1. Net working capital to sales ratio - 10% Miya Corporation Financials Actual Projected Sales Revenues 2 121,000.00 133,100.00 Sales 100,000.00 110,000.00 146410.00 Current Assets Net Property, Plant & Equipment Total Accruals & Payables Long-term debt Equity Total 15,000.00 40,000.00 55,000.00 5.0x00.00 25,000.00 25,000.00 55.000.00 1.00 16,500.00 44,000.00 60,500.00 5.500,00 27.500,00 27,500.00 60,500.00 Proforma Balance Sheets (5000) 2 3 2.00 3.00 18.150.00 19,965.00 48,400.00 53,240.00 66,550,00 23.205.00 6,050.00 5,655.00 30,250.00 33,275.00 30,250.00 33.275.00 66,550.00 73,205.00 4.00 21.961.50 S8.564.00 80.525.50 7320250 36,602.50 36,00 50 80,525 50 Invested Capital 50.000.00 55,000.00 60,500.00 66,550,00 73.205.00 Sales Cost of goods sold Gross profit Operating expenses (excluding depreciation) Depreciation expense Operating income (Earnings Before Interest and Taxes) Less: Interest expense Earnings before taxes Less: Taxes Net income 1 110,000.00 138,500.00) 71.500.00 (38,500.00) (8,000.00) 25,000.00 (2,000.00) 23,000.00 16,900.00) 16,100.00 Pro Forma Income Statements.(5000) 2 3 121,000.00 133,100.00 (42,350.00) (46.585.00) 78,650.00 86,515.00 (42,350.00) (46,585.00) 18,400.00) (8,840.00) 27,900.00 31,090.00 12,200.00) 12,420.00) 25,700.00 28,670.00 17.710.00) (8,601.00) 17,990.00 20,069.00 4 146,410.00 (51.243.50) 95.166.50 (51.243.50 (9,324,00) 34,599.00 (2.562.00) 31,337.00 19.581.10) 22,355.90 Actual Sales 100,000.00 110,000.00 146,410.00 2.00 Current Assets Net Property, Plant & Equipment Total Accruals & Payables Long-term debt Equity Total 15,000.00 40,000.00 55,000.00 5,000.00 25,000.00 25,000.00 55,000.00 1.00 16,500.00 44,000.00 60,500.00 5,500.00 27,500.00 27,500.00 60,500.00 4.00 21,961.50 58,564.00 80,525.50 7,320.50 36,602.50 36,602.50 80,525.50 Projected Sales Revenues 2 121,000.00 133,100.00 Proforma Balance Sheets (5000) 2 3.00 18,150.00 19,965.00 48,400.00 53,240,00 66,550.00 73,205,00 6,050.00 6,655.00 30,250.00 33.275.00 30,250.00 33,275.00 66,550.00 73,205.00 Pro Forma Income Statements (5000) 3 121,000.00 133,100.00 (42,350.00) (46,585.00) 78,650,00 86,515.00 (42,350.00) (46,585.00) (8.400.00) (8,840.00) 27,900.00 31,090.00 12,200,00) 12.420.00) 25,700.00 28,670.00 17.710.00) 18.601.00) 17,990.00 20.069.00 27,900.00 31,090.00 (8,370,00) 19,327.00) 19.530.00 21,763.00 Sales Cost of goods sold Gross profit Operating expenses (excluding depreciation) Depreciation expense Operating income (Earnings Before Interest and Taves) Less: Interest expense Earnings before taxes Less: Taxes Net income Operating income (Earings Before Interest and Taxes) La Cash tax payments Net operating profits after taxes (NOPAT 1 110,000.00 (38,500.00) 71,500.00 (38,500.00) (8,000.00) 25,000.00 12,000.00) 23,000.00 (6,900.00) 16,100.00 25,000.00 (7,500.00) 17,500.00 146,410.00 (51,243.50) 95,166.50 151,243.50) 19,324,00) 34,599.00 12,662.00) 31.93700 19,581.10) 22,355.90 34,599.00 (10,379.70) 24,219.30 Assume that firm revenues grow at a rate of 10% per year during years 1 through 4 before leveling out at no growth for year 5 and beyond. You may also assume that Miya's gross profit margin is 65%; operating expenses (before depreciation) to sales is 35%; current assets to sales is 15%; accounts payable to sales is 5%; and net property, plant, and equipment (PPE) to sales is 40%; Net working capital to sales ratio is 10%, and that Miya maintains equal dollar amounts of long-term debt and equity to finance its growing needs for invested capital. The projected financial statements of Miya Corporation are as follows: Miya Corporation Financials Acta Sales 100 DOO 00 110,000 1.000.00 111000 34600 Protesti 300 31,50 Current sets Netheperty, partim Total en Payables Lorele 2.00 0.00 SOLD SESSO 3500.00 10.000.00 55.000.00 SO DE 25 200.00 25 000.00 5.000.00 200 15,900.00 G. Sood 5.900.00 27.500.00 20.100.00 6.500 23.00 7320500 5.655. 33.275.00 275.00 2025000 20.250 50 od 20525.50 332050 000 36 502 50 $6325.50 Total West Capital 50.000 SS 00.00 SO HO Prements 5000 115,000.00 TMO DE Sales Corto con Grupo Operating corecar Doctor Opera nestand 100 OC 46 ISO S. HO DO 72,100.00 B000 B. 2.000.00 2.000 21.000.00 200.00 20 142350.00 200.00 2350 122300 2. 981565 52450 140 .. Tarnobre Le 12.40 267000 100 1100 11 225 Also assume that the cost of unlevered equity in this case is 13%. The cost of debt remains at 8%. The corporate tax rate is 30%. Please assume that the WACC for the terminal value is 13%. Calculate the enterprise value using the APV method (Enterprise Value = Value of the Unievered Free Cash Flows for the Planning Period + Value of the Planning Period interest Tax Saving Present Value of the Estimated Terminal Value) Hints: CAPEX for yeart - Net PP&E for year t-Net PP&E for yeart-1 + Depreciation expense for yeart Changes in NWC for yeart - NWC for year t-NWC for year t-1. Net working capital to sales ratio - 10% Miya Corporation Financials Actual Projected Sales Revenues 2 121,000.00 133,100.00 Sales 100,000.00 110,000.00 146410.00 Current Assets Net Property, Plant & Equipment Total Accruals & Payables Long-term debt Equity Total 15,000.00 40,000.00 55,000.00 5.0x00.00 25,000.00 25,000.00 55.000.00 1.00 16,500.00 44,000.00 60,500.00 5.500,00 27.500,00 27,500.00 60,500.00 Proforma Balance Sheets (5000) 2 3 2.00 3.00 18.150.00 19,965.00 48,400.00 53,240.00 66,550,00 23.205.00 6,050.00 5,655.00 30,250.00 33,275.00 30,250.00 33.275.00 66,550.00 73,205.00 4.00 21.961.50 S8.564.00 80.525.50 7320250 36,602.50 36,00 50 80,525 50 Invested Capital 50.000.00 55,000.00 60,500.00 66,550,00 73.205.00 Sales Cost of goods sold Gross profit Operating expenses (excluding depreciation) Depreciation expense Operating income (Earnings Before Interest and Taxes) Less: Interest expense Earnings before taxes Less: Taxes Net income 1 110,000.00 138,500.00) 71.500.00 (38,500.00) (8,000.00) 25,000.00 (2,000.00) 23,000.00 16,900.00) 16,100.00 Pro Forma Income Statements.(5000) 2 3 121,000.00 133,100.00 (42,350.00) (46.585.00) 78,650.00 86,515.00 (42,350.00) (46,585.00) 18,400.00) (8,840.00) 27,900.00 31,090.00 12,200.00) 12,420.00) 25,700.00 28,670.00 17.710.00) (8,601.00) 17,990.00 20,069.00 4 146,410.00 (51.243.50) 95.166.50 (51.243.50 (9,324,00) 34,599.00 (2.562.00) 31,337.00 19.581.10) 22,355.90 Actual Sales 100,000.00 110,000.00 146,410.00 2.00 Current Assets Net Property, Plant & Equipment Total Accruals & Payables Long-term debt Equity Total 15,000.00 40,000.00 55,000.00 5,000.00 25,000.00 25,000.00 55,000.00 1.00 16,500.00 44,000.00 60,500.00 5,500.00 27,500.00 27,500.00 60,500.00 4.00 21,961.50 58,564.00 80,525.50 7,320.50 36,602.50 36,602.50 80,525.50 Projected Sales Revenues 2 121,000.00 133,100.00 Proforma Balance Sheets (5000) 2 3.00 18,150.00 19,965.00 48,400.00 53,240,00 66,550.00 73,205,00 6,050.00 6,655.00 30,250.00 33.275.00 30,250.00 33,275.00 66,550.00 73,205.00 Pro Forma Income Statements (5000) 3 121,000.00 133,100.00 (42,350.00) (46,585.00) 78,650,00 86,515.00 (42,350.00) (46,585.00) (8.400.00) (8,840.00) 27,900.00 31,090.00 12,200,00) 12.420.00) 25,700.00 28,670.00 17.710.00) 18.601.00) 17,990.00 20.069.00 27,900.00 31,090.00 (8,370,00) 19,327.00) 19.530.00 21,763.00 Sales Cost of goods sold Gross profit Operating expenses (excluding depreciation) Depreciation expense Operating income (Earnings Before Interest and Taves) Less: Interest expense Earnings before taxes Less: Taxes Net income Operating income (Earings Before Interest and Taxes) La Cash tax payments Net operating profits after taxes (NOPAT 1 110,000.00 (38,500.00) 71,500.00 (38,500.00) (8,000.00) 25,000.00 12,000.00) 23,000.00 (6,900.00) 16,100.00 25,000.00 (7,500.00) 17,500.00 146,410.00 (51,243.50) 95,166.50 151,243.50) 19,324,00) 34,599.00 12,662.00) 31.93700 19,581.10) 22,355.90 34,599.00 (10,379.70) 24,219.30