

Question
Assume that industry ratios were derived from a reputable source. Compute the year 1 and year 2 ratios for Alpha and Omega. Using your calculated
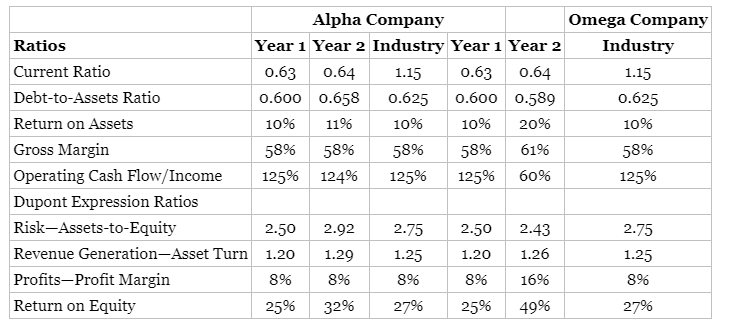
Assume that industry ratios were derived from a reputable source. Compute the year 1 and year 2 ratios for Alpha and Omega.
Using your calculated ratios describe any symptoms of fraud and combine the findings in the ratio analysis with the metrics calculated in assignment 1 and draw a conclusion about fraud prediction and recommend the next steps.
Step by Step Solution
There are 3 Steps involved in it
Step: 1

Get Instant Access to Expert-Tailored Solutions
See step-by-step solutions with expert insights and AI powered tools for academic success
Step: 2

Step: 3
Ace Your Homework with AI
Get the answers you need in no time with our AI-driven, step-by-step assistance
Get Started
The Ultra High Net Worth Bankers Handbook
Authors: Heinrich Weber, Stephan Meier
1st Edition
1905641753, 978-1905641758