Answered step by step
Verified Expert Solution
Question
1 Approved Answer
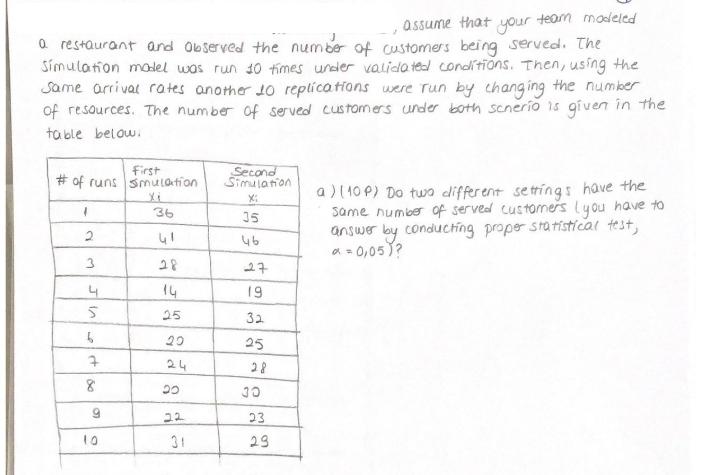
assume that team modeled your a restaurant and observed the number of customers being served. The Simulation model was run 10 times under validated


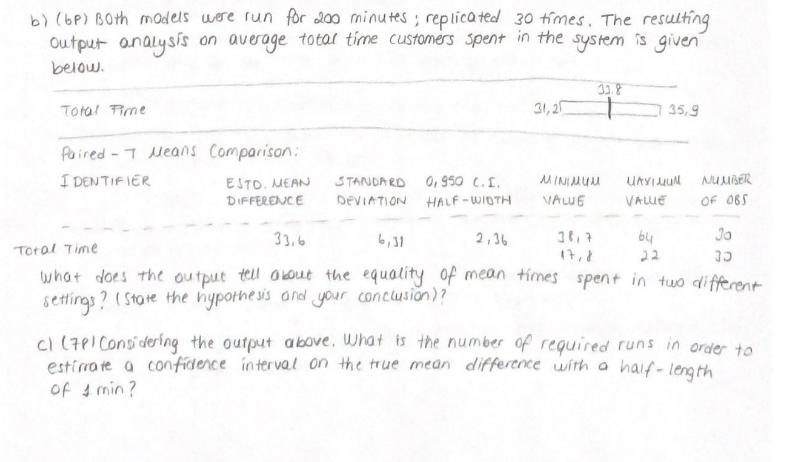
assume that team modeled your a restaurant and observed the number of customers being served. The Simulation model was run 10 times under validated conditions. Then, using the Same arrival rates another 10 replications were run by changing the number of resources. The number of served customers under both scnerio is given in the table below. First # of runs smulation 1 2 3 4 5 6 7 8 9 10 36 41 28 14 25 20 24 20 22 31 Second Simulation X: 35 46 27 19 32 25 28 30 ad 23 29 2 a) [10P) Do two different settings have the same number of served customers (you have to answer conducting proper statistical test, a = 0,05)? by b) (bp) Both models were run for 200 minutes; replicated 30 times. The resulting output analysis on average total time customers spent in the system is given below. Total Time Paired - T Means Comparison: IDENTIFIER ESTO. MEAN DIFFERENCE STANDARD 0,950 C.I. DEVIATION HALF-WIDTH 31,2 33.8 MINIMUM VALUE VALUE 35,9 64 22 NUMBER OF 065 30 33,6 2,36 Total Time 17,8 30 what does the output tell about the equality of mean times spent in two different settings? (State the hypothesis and your conclusion)? c) (7P) Considering the output above. What is the number of required runs in order to estimate a confidence interval on the true mean difference with a half-length of 1 min?
Step by Step Solution
There are 3 Steps involved in it
Step: 1

Get Instant Access to Expert-Tailored Solutions
See step-by-step solutions with expert insights and AI powered tools for academic success
Step: 2

Step: 3

Ace Your Homework with AI
Get the answers you need in no time with our AI-driven, step-by-step assistance
Get Started


