Answered step by step
Verified Expert Solution
Link Copied!

Question

1 Approved Answer

Assume that the following graph depicts aggregate supply and demand conditions in an economy. Full employment occurs when $2.5 trillion of real output is produced.
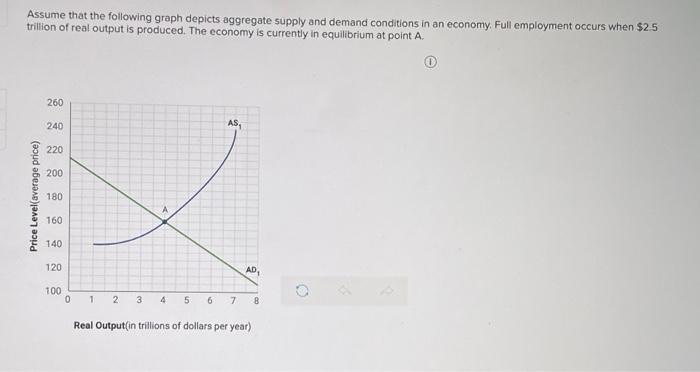
image text in transcribed
Assume that the following graph depicts aggregate supply and demand conditions in an economy. Full employment occurs when $2.5 trillion of real output is produced. The economy is currently in equilibrium at point A. 260 240 AS, 220 200 Price Level(average price) 180 160 140 120 AD 100 0 1 2 3 4 5 6 7 8 Real Output(in trillions of dollars per year) Instructions: In parts a and b, enter your responses rounded to one decimal place. In part c, round your answer to the nearest whole number a. What is the equilibrium rate of output? trillion per year b. How much in excess of full employment is the equilibrum rate of output? trillion c. If aggregate demand shifted enough for the economy to reach full-employment equilibrium, what is the price level at this full- employment equilibrium

Step by Step Solution

There are 3 Steps involved in it

Step: 1

blur-text-image

Get Instant Access to Expert-Tailored Solutions

See step-by-step solutions with expert insights and AI powered tools for academic success

Step: 2

blur-text-image

Step: 3

blur-text-image

Ace Your Homework with AI

Get the answers you need in no time with our AI-driven, step-by-step assistance

Get Started

Recommended Textbook for

Financial Accounting A Management Perspective

Authors: Nelson Macwan

1st Edition

6206142191, 978-6206142195

More Books

Students also viewed these Accounting questions