Question
Assume that thermometer readings are normally distributed with a mean of 0C and a standard deviation of 1.00C. A thermometer is randomly selected and tested.
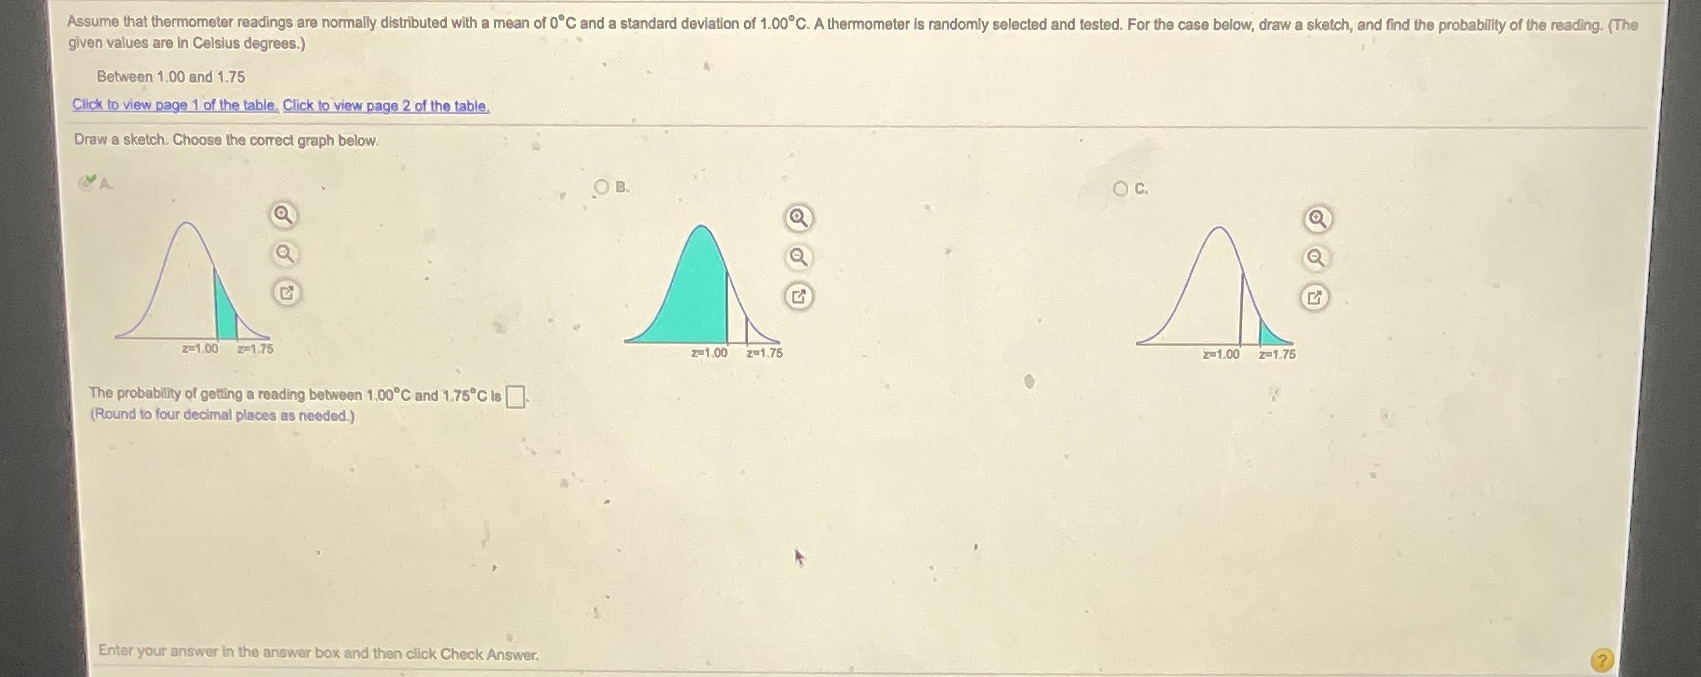
Assume that thermometer readings are normally distributed with a mean of 0C and a standard deviation of 1.00C. A thermometer is randomly selected and tested. For the case? below, draw a? sketch, and find the probability of the reading.? (The given values are in Celsius? degrees.)Between 1.00 and 1.75Click to view page 1 of the table. LOADING... Click to view page 2 of the table. LOADING...Draw a sketch. Choose the correct graph below.A.z=1.00z=1.75 A graph with a bell-shaped curve, divided into 3 regions by 2 lines from top to bottom, both on the right side. The region between the 2 lines is shaded. Moving from left to right, the z-axis below the first line is labeled "z=1.00". The z-axis below the second line is labeled "z=1.75".Your answer is correct.B.z=1.00z=1.75 A graph with a bell-shaped curve, divided into 3 regions by 2 lines from top to bottom, both on the right side. Moving from left to right, the region left of the first line is shaded. The z-axis below this line is labeled "z=1.00". The z-axis below the second line is labeled "z=1.75".C.z=1.00z=1.75 A graph with a bell-shaped curve, divided into 3 regions by 2 lines from top to bottom, both on the right side. Moving from left to right, the region right of the second line is shaded. The z-axis below this line is labeled "z=1.75". The z-axis below the first line is labeled "z=1.00".The probability of getting a reading between 1.00C and 1.75C is nothing.?(Round to four decimal places as? needed.)
Step by Step Solution
There are 3 Steps involved in it
Step: 1

Get Instant Access to Expert-Tailored Solutions
See step-by-step solutions with expert insights and AI powered tools for academic success
Step: 2

Step: 3
Ace Your Homework with AI
Get the answers you need in no time with our AI-driven, step-by-step assistance
Get Started