Assume that you are a financial manager at Sears and want to compare your firm's situation with that of Target. Calculate representative ratios for liquidity, asset management efficiency, financial leverage (capital structure), and profitability for both Sears and Target. How would you summarize the financial performance of Sears compared to Target (its benchmark firm)?
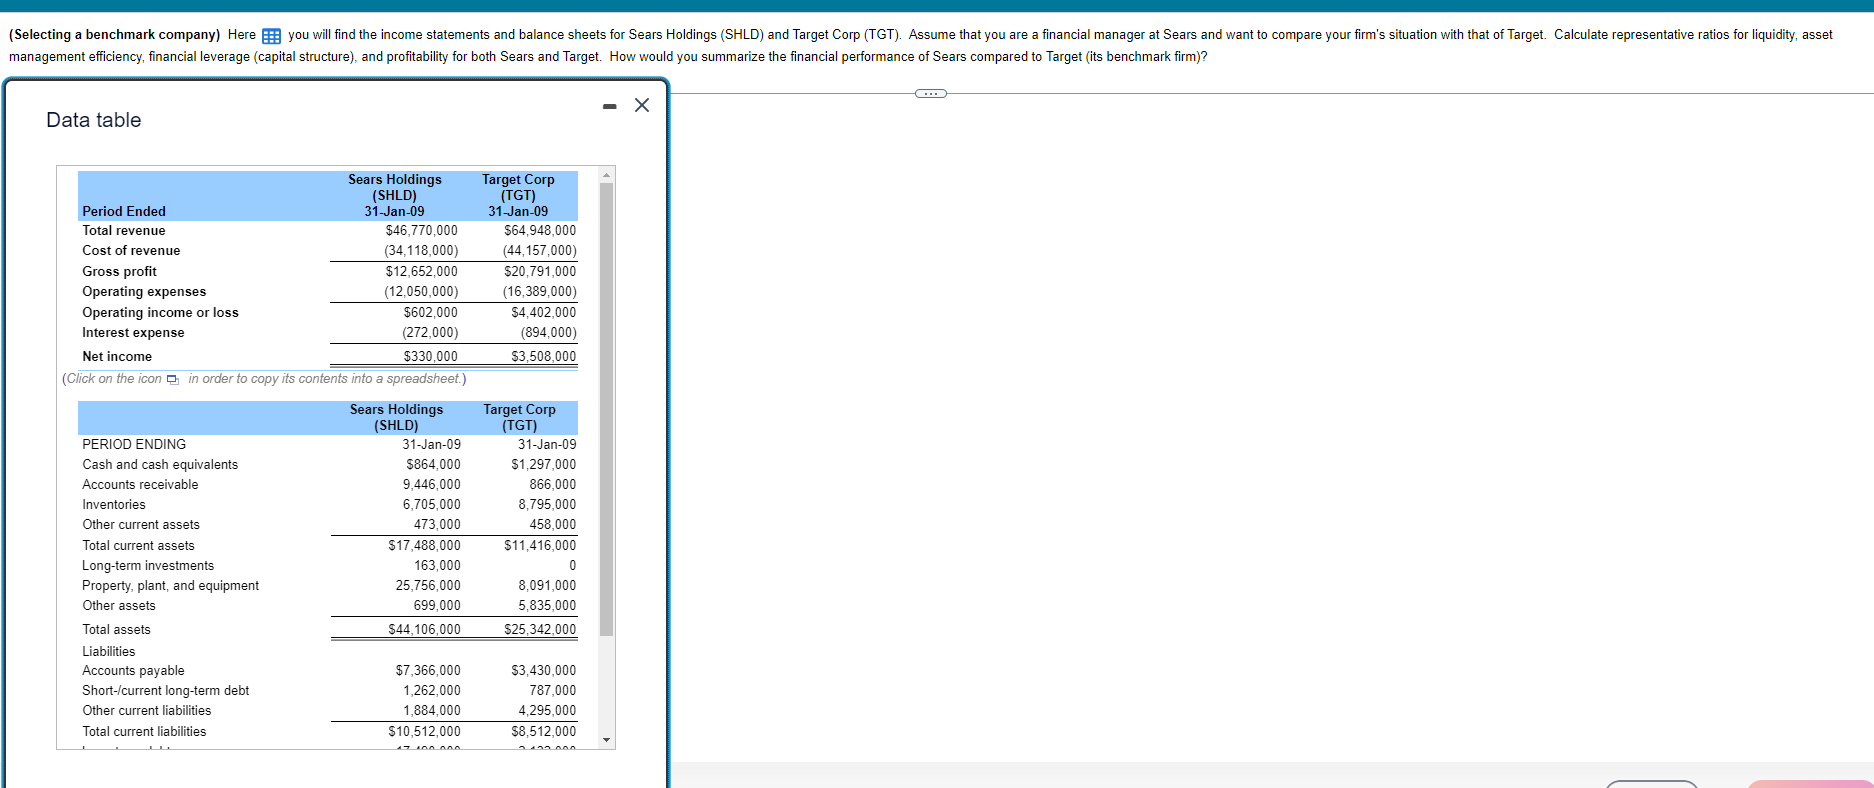
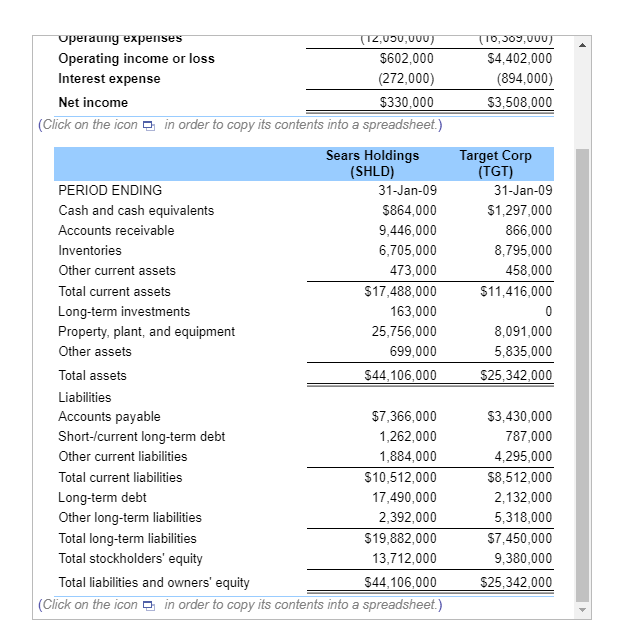
(Selecting a benchmark company) Here you will find the income statements and balance sheets for Sears Holdings (SHLD) and Target Corp (TGT). Assume that you are a financial manager at Sears and want to compare your firm's situation with that of Target. Calculate representative ratios for liquidity, asset management efficiency, financial leverage (capital structure), and profitability for both Sears and Target. How would you summarize the financial performance of Sears compared to Target (its benchmark firm)? C X Data table Target Corp (TGT) 31-Jan-09 Period Ended Total revenue Sears Holdings (SHLD) 31-Jan-09 $46,770,000 (34,118,000) $12,652,000 (12,050,000) Cost of revenue Gross profit Operating expenses Operating income or loss $602,000 Interest expense (272,000) Net income $330,000 (Click on the icon in order to copy its contents into a spreadsheet.) Sears Holdings (SHLD) PERIOD ENDING Cash and cash equivalents Accounts receivable Inventories Other current assets. Total current assets Long-term investments Property, plant, and equipment Other assets Total assets Liabilities Accounts payable Short-/current long-term debt Other current liabilities Total current liabilities 31-Jan-09 $864,000 9,446,000 6,705,000 473,000 $17,488,000 163,000 25,756,000 699,000 $44,106,000 $7,366,000 1,262,000 1,884,000 $10,512,000 17 100 000 $64,948,000 (44,157,000) $20,791,000 (16,389,000) $4,402,000 (894,000) $3,508,000 Target Corp (TGT) 31-Jan-09 $1,297,000 866,000 8,795,000 458,000 $11,416,000 8,091,000 5,835,000 $25,342,000 $3,430,000 787,000 4,295,000 $8,512,000 Operaung expenses (12,050,000) Operating income or loss $602,000 Interest expense (272,000) Net income $330,000 (Click on the icon in order to copy its contents into a spreadsheet.) Sears Holdings (SHLD) PERIOD ENDING 31-Jan-09 Cash and cash equivalents $864,000 9,446,000 Accounts receivable Inventories 6,705,000 Other current assets 473,000 Total current assets $17,488,000 Long-term investments 163,000 Property, plant, and equipment 25,756,000 Other assets 699,000 Total assets $44,106,000 Liabilities Accounts payable $7,366,000 Short-/current long-term debt 1,262,000 Other current liabilities 1,884,000 $10,512,000 Total current liabilities Long-term debt 17,490,000 Other long-term liabilities 2,392,000 Total long-term liabilities $19,882,000 Total stockholders' equity 13,712,000 Total liabilities and owners' equity $44,106,000 (Click on the icon in order to copy its contents into a spreadsheet.) (10,509,000) $4,402,000 (894,000) $3,508,000 Target Corp (TGT) 31-Jan-09 $1,297,000 866,000 8,795,000 458,000 $11,416,000 0 8,091,000 5,835,000 $25,342,000 $3,430,000 787,000 4,295,000 $8,512,000 2,132,000 5,318,000 $7,450,000 9,380,000 $25,342,000 (Selecting a benchmark company) Here you will find the income statements and balance sheets for Sears Holdings (SHLD) and Target Corp (TGT). Assume that you are a financial manager at Sears and want to compare your firm's situation with that of Target. Calculate representative ratios for liquidity, asset management efficiency, financial leverage (capital structure), and profitability for both Sears and Target. How would you summarize the financial performance of Sears compared to Target (its benchmark firm)? C X Data table Target Corp (TGT) 31-Jan-09 Period Ended Total revenue Sears Holdings (SHLD) 31-Jan-09 $46,770,000 (34,118,000) $12,652,000 (12,050,000) Cost of revenue Gross profit Operating expenses Operating income or loss $602,000 Interest expense (272,000) Net income $330,000 (Click on the icon in order to copy its contents into a spreadsheet.) Sears Holdings (SHLD) PERIOD ENDING Cash and cash equivalents Accounts receivable Inventories Other current assets. Total current assets Long-term investments Property, plant, and equipment Other assets Total assets Liabilities Accounts payable Short-/current long-term debt Other current liabilities Total current liabilities 31-Jan-09 $864,000 9,446,000 6,705,000 473,000 $17,488,000 163,000 25,756,000 699,000 $44,106,000 $7,366,000 1,262,000 1,884,000 $10,512,000 17 100 000 $64,948,000 (44,157,000) $20,791,000 (16,389,000) $4,402,000 (894,000) $3,508,000 Target Corp (TGT) 31-Jan-09 $1,297,000 866,000 8,795,000 458,000 $11,416,000 8,091,000 5,835,000 $25,342,000 $3,430,000 787,000 4,295,000 $8,512,000 Operaung expenses (12,050,000) Operating income or loss $602,000 Interest expense (272,000) Net income $330,000 (Click on the icon in order to copy its contents into a spreadsheet.) Sears Holdings (SHLD) PERIOD ENDING 31-Jan-09 Cash and cash equivalents $864,000 9,446,000 Accounts receivable Inventories 6,705,000 Other current assets 473,000 Total current assets $17,488,000 Long-term investments 163,000 Property, plant, and equipment 25,756,000 Other assets 699,000 Total assets $44,106,000 Liabilities Accounts payable $7,366,000 Short-/current long-term debt 1,262,000 Other current liabilities 1,884,000 $10,512,000 Total current liabilities Long-term debt 17,490,000 Other long-term liabilities 2,392,000 Total long-term liabilities $19,882,000 Total stockholders' equity 13,712,000 Total liabilities and owners' equity $44,106,000 (Click on the icon in order to copy its contents into a spreadsheet.) (10,509,000) $4,402,000 (894,000) $3,508,000 Target Corp (TGT) 31-Jan-09 $1,297,000 866,000 8,795,000 458,000 $11,416,000 0 8,091,000 5,835,000 $25,342,000 $3,430,000 787,000 4,295,000 $8,512,000 2,132,000 5,318,000 $7,450,000 9,380,000 $25,342,000